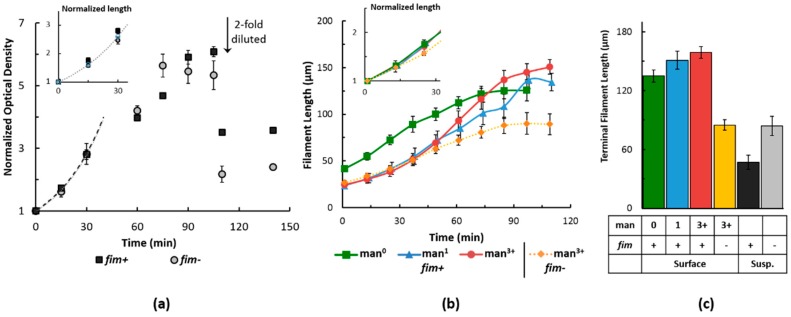
Figure 4.
Growth trends of antibiotic-induced filamentous cells. (a) Comparison between nonfimbriated (fim−) and fimbriated (fim+) cells during filamentous growth in suspended cultures. Time points were measured as the optical density of the culture at 600 nm and normalized to the optical density of the same sample at 0 min. Where indicated, cultures were diluted two-fold prior to measurement and continued culturing. The inset plots early time points (x axis) as a function of filament length (measured by optical microscopy) normalized to the corresponding mean length at time zero (y axis). The dashed lines in the figure and inset show an exponential fit of the first three time points to obtain the growth rates. At least three independent samples were measured; error bars represent normalized standard error of the data; (b) comparison of filament growth dynamics between fim− and fim+ cells during filamentous growth when attached in microfluidic channels with varied mannose content. The substrate was either not mannosylated (man0), or presented either monomeric (man1), or oligomeric mannose (man3+). Time points show mean filament length with standard error, calculated from roughly 10 cells that were analyzed in duplicate independent experiments. The inset highlights the early time points (x axis) as mean normalized lengths (y axis), calculated from the length per cell as a ratio to its initial length; and (c) terminal length of filamentous cells on different substrates vs. suspended culture after reaching a stationary growth phase, measured from roughly 25 cells in duplicate experiments; the error bars are standard error from the terminal length.

