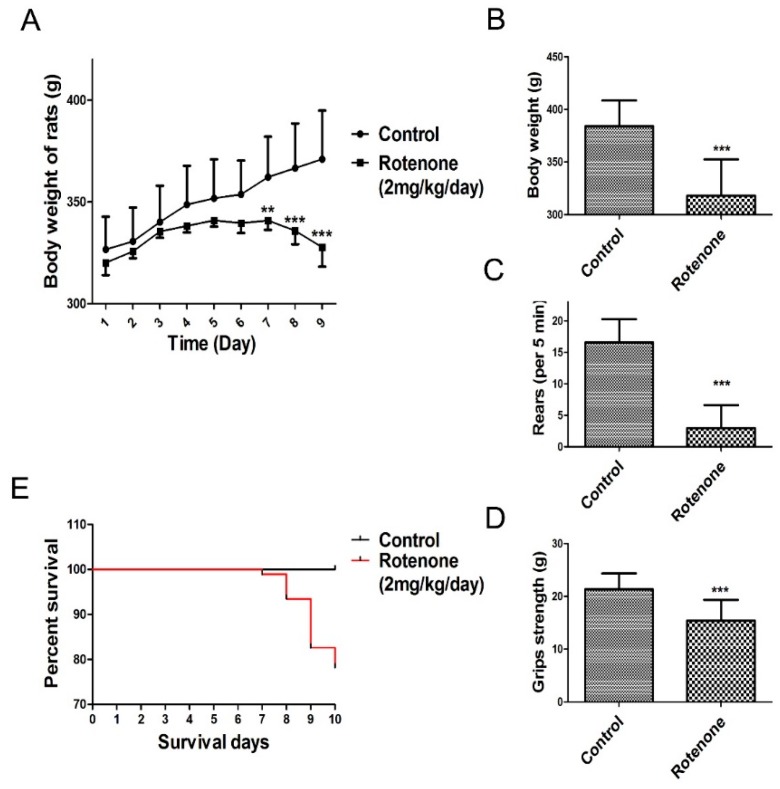
Figure 2.
Changes in body weight and behavioral parameters of the PD model. The parameters are presented as the mean ± SD, * compared to control, (** p < 0.01, *** p < 0.001, rotenone: n = 92, control: n = 10). (A) Body weight change during rotenone treatment from day 1 to day 9; (B) Day 10 body weight change during rotenone treatment; (C) Rearing behavior result after 10 days of rotenone treatment; (D) Grip strength result after 10 days of rotenone treatment; (E) Survival of during 10 days rotenone treatment.

