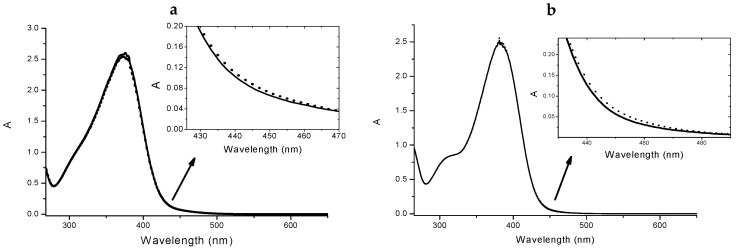
Figure 4.
Absorption spectra of 4 4 × 10⁻⁵ M in absence (solid line) and in presence (dotted line) of 2.5 × 10⁻⁵ M Cu(II) (a). Inset: spectral detail of the changing upon the addiction of the metal. Absorption spectra of 5 4 × 10⁻⁵ M in absence (solid line) and in presence (dotted line) of 2.5 × 10⁻⁵ M Cu(II) (b). Inset: spectral detail.

