Figure 4.
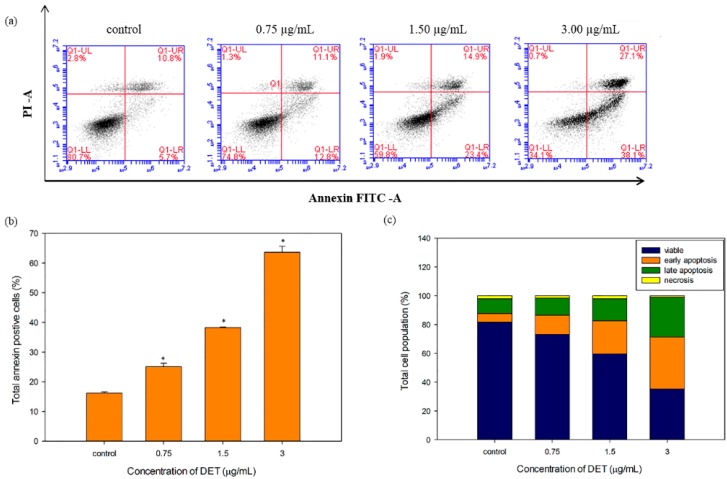
Externalization of phosphatidylserine induced by different concentrations of deoxyelephantopin (0.75–3.0 µg/mL) detected using Annexin V-FITC/PI staining at 24 h. (a) displayed the flow cytometric fluorescence patterns; (b) The bar chart showed the percentage of Annexin V positive cells; (c) The bar chart summarized the percentage of viable, early apoptotic, late apoptotic and necrotic cells. The data expressed as mean ± S.E. from three individual experiments. Asterisks indicate significantly different value from control (* p < 0.001).

