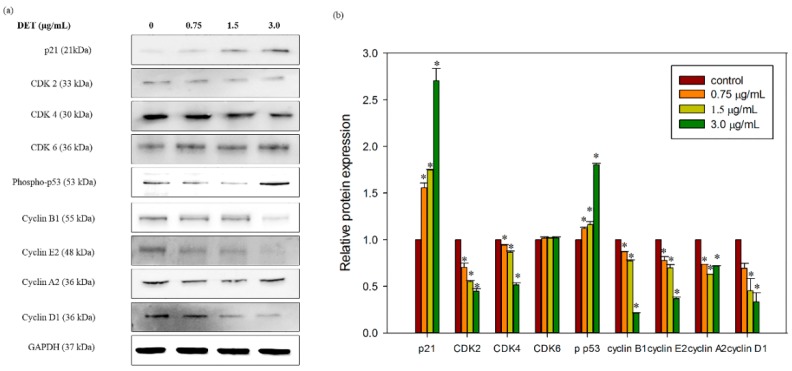
Figure 7.
Effect of DET on cell cycle-related protein expressions in HCT116 cells. HCT116 cells were treated with different concentrations of DET (0.75, 1.5 and 3.0 µg/mL) at 24 h. (a) Representative image of p21, phospho-p53, CDK2, CDK4, CDK6, cyclin B1, cyclin E2, Cyclin A2 and Cyclin D1 expression level with their respective western blot band intensity; (b) The bar chart showed the relative protein expression levels. The data expressed as mean ± S.E. from three individual experiments. Asterisks indicate significantly different value from control (* p < 0.001).

