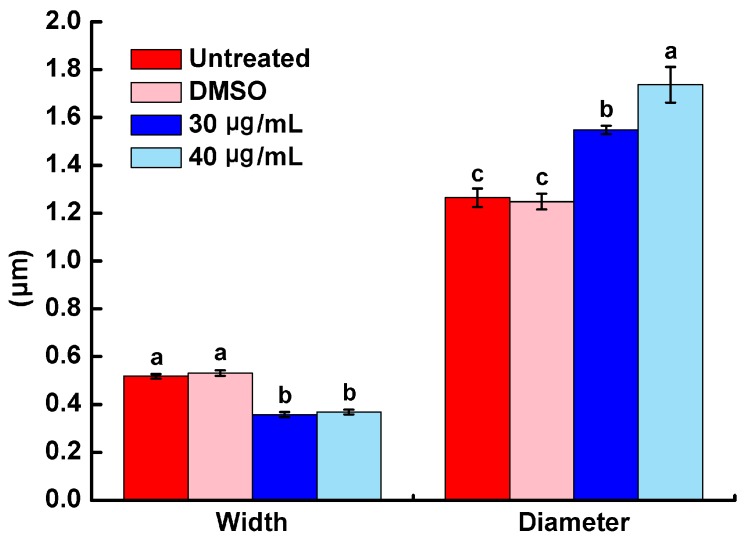
Figure 4.
Effects of different treatments on width and diameter of R. solanacearum cells. The mean value of width and diameter was calculated based on scale bars of SEM images. The error bars indicate the standard error of the mean from 100 cells. Lower case letters indicate significant differences according to Duncan’s test (p < 0.05).

