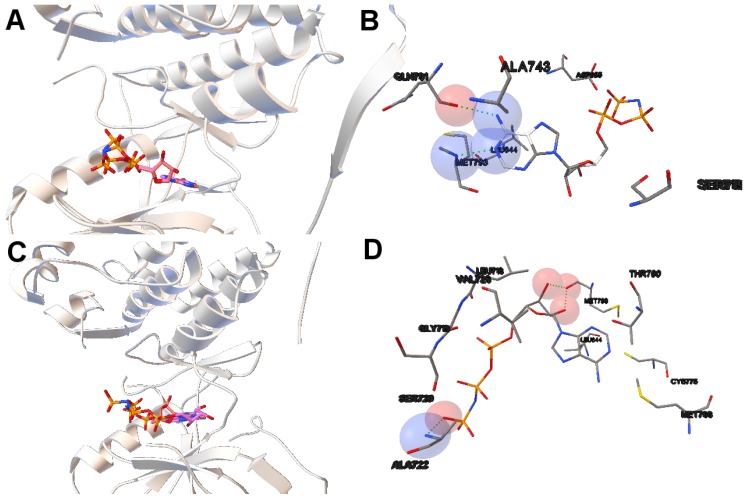
Figure 5.
(A,C) show the tri-dimensional kinase domains of the instances 2itn and 2eb3 with the mutations G719S and L858R, respectively. The computed and the reference (AMP-PNP) ligands are represented in red and pink, respectively. The computed ligands adopt the conformation of the reference ligands; (B,D) show the molecular interactions between the computed ligands AMP-PNP and the kinase domains of EGFR. The atoms involved in the H-bonds are shown as spheres. The color of these depends on the atom type. The H-bonds are represented by green spheres. The residues are also labeled, including the residues closer to the ligand–macromolecule interaction.

