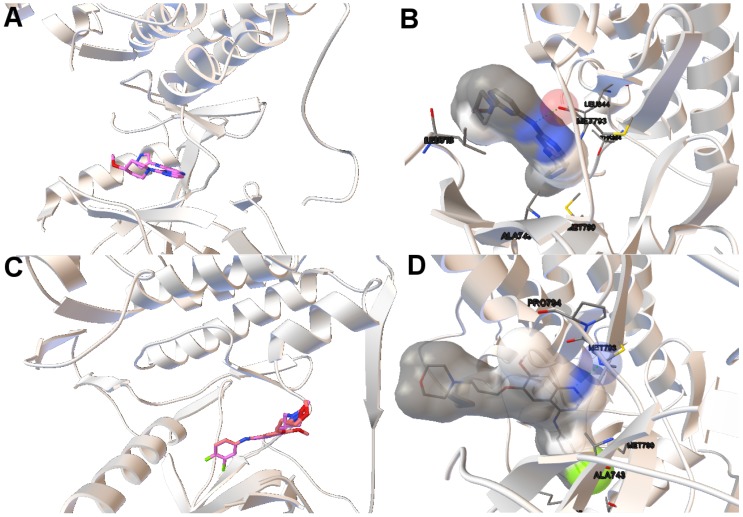
Figure 6.
(A,C) show the tri-dimensional structure with the reference/computed ligands for 4rj5 and 3ug2, respectively. The reference and computed ligands are represented in red and pink, respectively; images (B,D) show the molecular interaction between ligands and EGFR double mutant. The atoms involved in H-bonds are represented by colored spheres. H-bonds are represented by green spheres. The residues are also labeled, including the residues closer to the ligand–macromolecule interaction.

