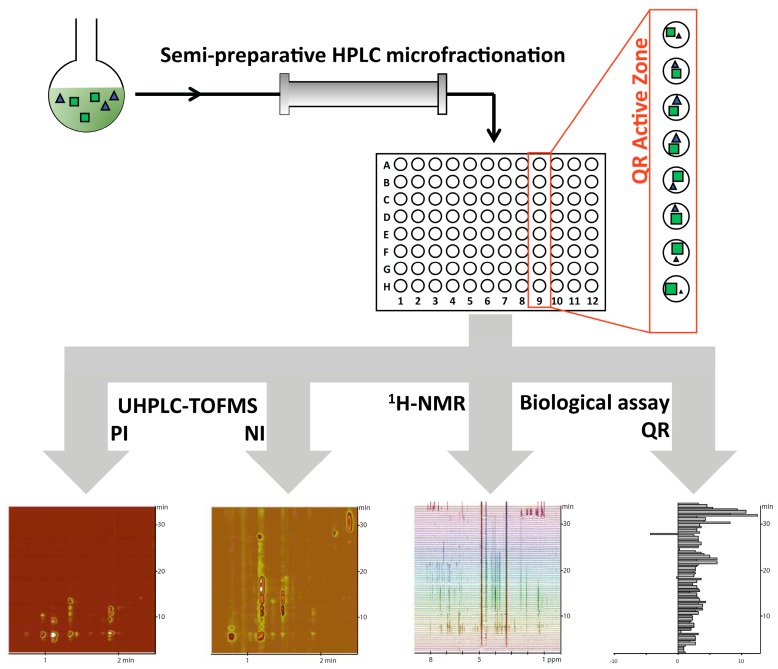
Figure 1.
General strategy to evaluate statistical correlations for deconvolution of spectral signals. The 18-compounds mixture was microfractionated by semi-preparative reversed phase HPLC and each fraction was profiled using UHPLC-TOFMS in positive (PI) and negative (NI) ionization modes, and 1H-NMR. In addition, each well was evaluated in a cell-based assay for quinone reductase (QR) induction activity.

