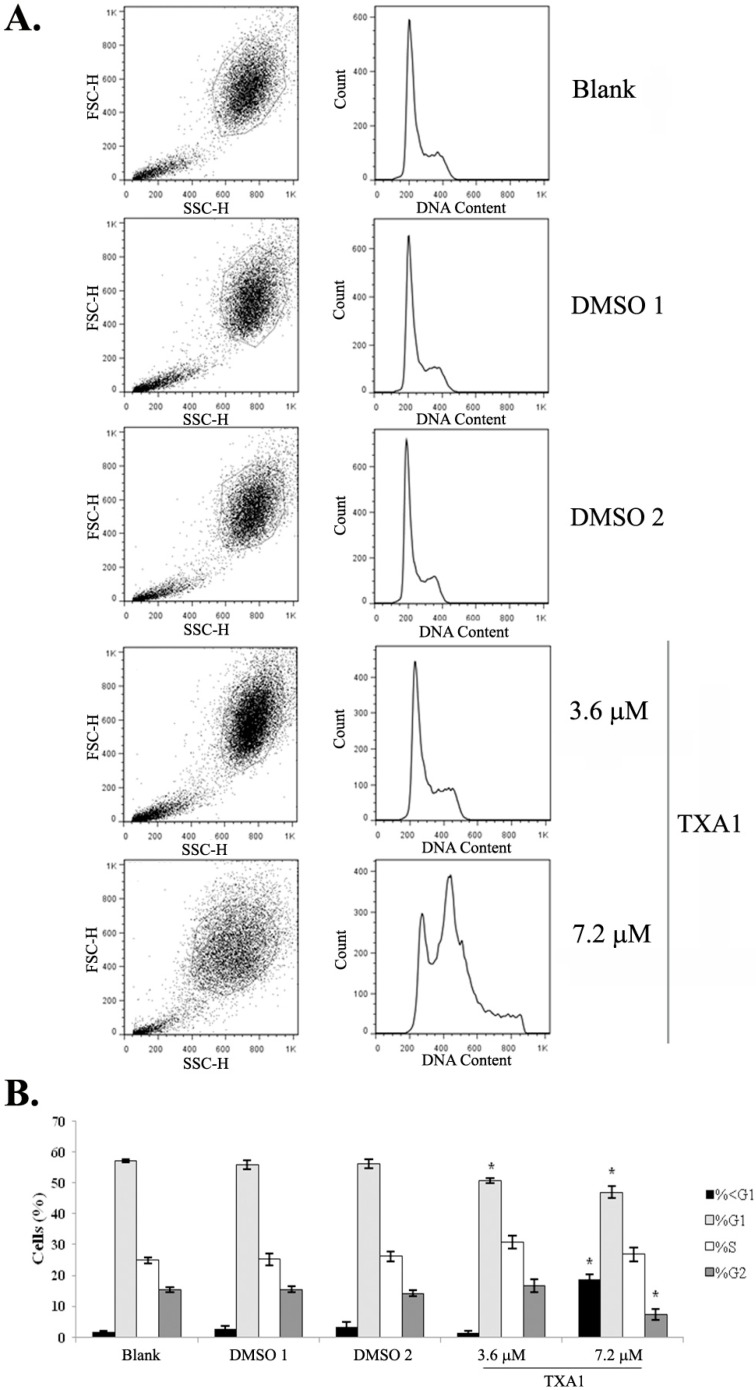
Figure 1.
The effect of TXA1 on the cell cycle profile of A373-C5 cells. Cells were treated for 48 h with medium (blank), with TXA1 (3.6 μM and 7.2 μM), or with the corresponding DMSO concentrations (DMSO 1 and DMSO 2, respectively). (A) Representative images of flow cytometry analyzed following DNA staining with propidium iodide (PI). Left panels correspond to dot plots of forward vs. side scatter (FSC vs. SSC) and show the gated population. Right panels correspond to the histograms with cell cycle profile of the gated population, following the exclusion of cellular aggregates and debris (data not shown); (B) The percentage of cells in the different cell cycle phases. Results are the mean ± SEM of four independent experiments. * p < 0.05 blank vs. treatment. Etoposide (2 μM) was used as positive control: G0/G1: 6.3% ± 2.0%; S: 10.4% ± 2.3%; G2/M: 78.3% ± 0.7%.

