Figure 4.
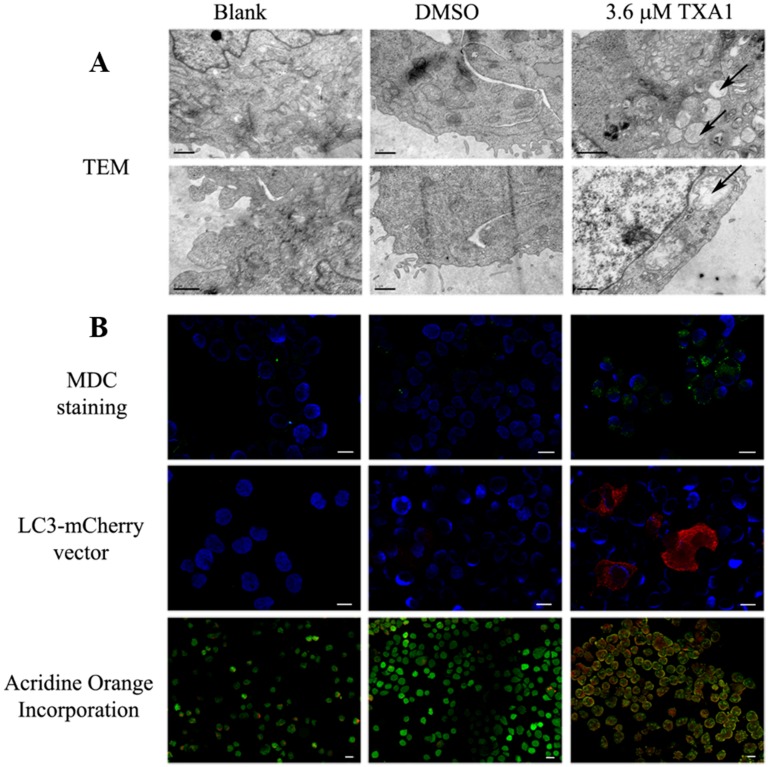
The effect of TXA1 on A375-C5 cellular autophagy. Cells were treated for 48 h with medium (blank), TXA1 (3.6 μM) or with the corresponding concentration of DMSO. (A) Transmission electron microscopy (TEM). Images are representative of two independent experiments. Arrows indicate autophagic structures. Bar corresponds to 1 μm; (B) Fluorescence microscopy analysis after (top panel) MDC staining (green); (middle panel) transfection with LC3-mCherry vector (red); and (lower panel) acridine orange incorporation (orange-red). Cell nuclei are stained with DAPI (blue). Bar = 20 μm. Images are representative of two experiments (except for MDC assay which is representative of three experiments).

