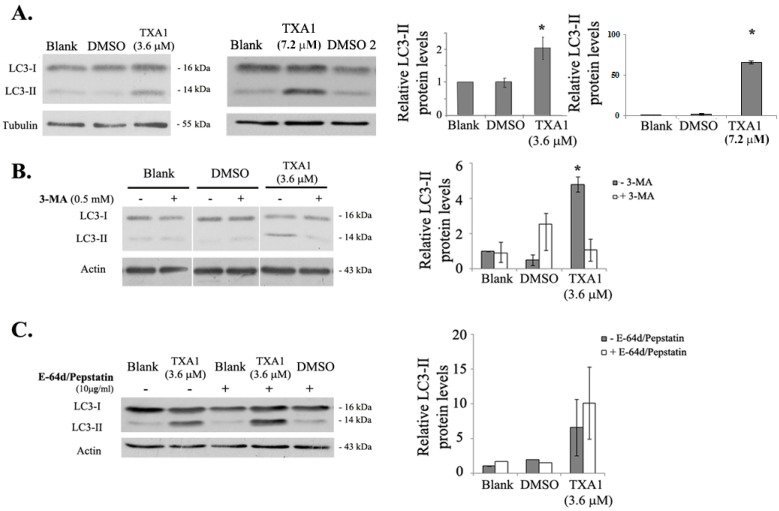
Figure 5.
Effect of TXA1 on the expression levels of LC3-II in A375-C5 cells. Cells were treated for 48 h with medium (blank), TXA1 (3.6 μM or 7.2 μM), or with the corresponding DMSO concentrations (DMSO or DMSO2, respectively) LC3-II protein levels were analyzed by Western blot. (A) Following treatment with TXA1 alone; (B) following co-treatment with 3-MA; and (C) following co-treatment with E-64d/pepstatin. Images are representative of, at least, three independent experiments (except for the case of blank and DMSO treatments in the presence of E-64d/pepstatin, which result from two experiments only). Results of the densitometry analysis are expressed after normalization of the values obtained for each protein with the values obtained for tubulin or actin (and further expressed in relation to blank cells) and represent the mean ± SEM from, at least, three independent experiments (except for the case of blank and DMSO treatments in the presence of E-64d/pepstatin, which result from two experiments only). * p ≤ 0.05 Blank vs. treatment.

