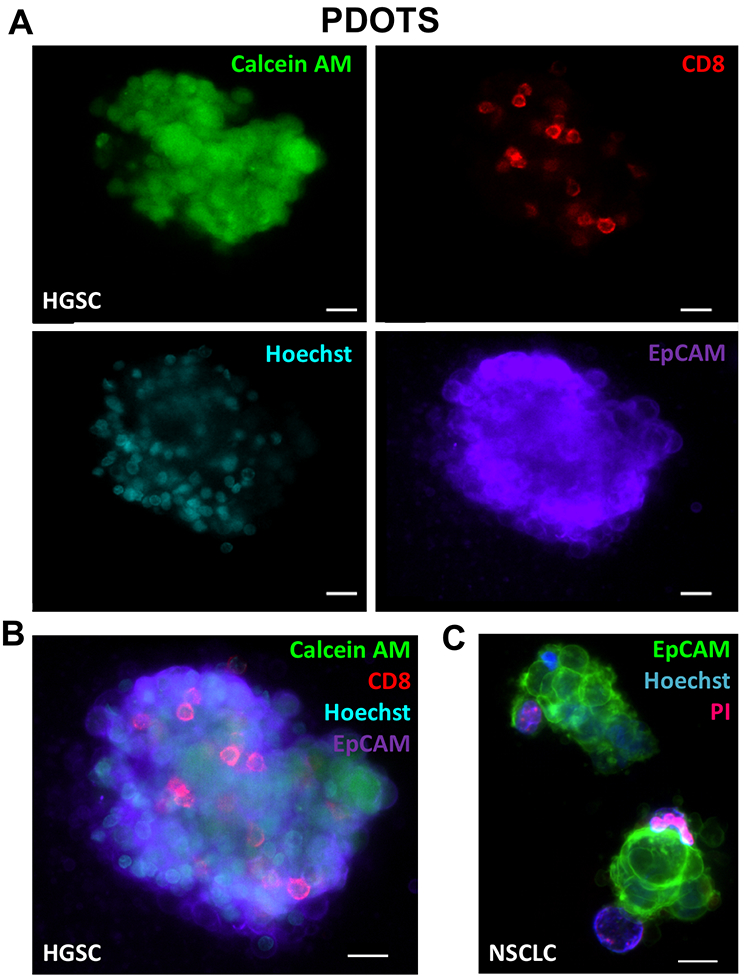
Figure 5 – Fluorescence Imaging of Patient-Derived Organotypic Tumor Spheroids.

(A-B), baseline IF staining of HGSC PDOTS demonstrating viable cells (calcein AM; green), CD8 T cells (red), tumor cells (EpCAM; purple), and all nucleated cells (Hoechst; blue). C, overlay IF image of NSCLC PDOTS demonstrating EpCAM positive tumor cells (green), all nucleated cells (Hoechst; blue), and dead cells (PI; red). Scale bars indicate 20 μm (A, B, C).
