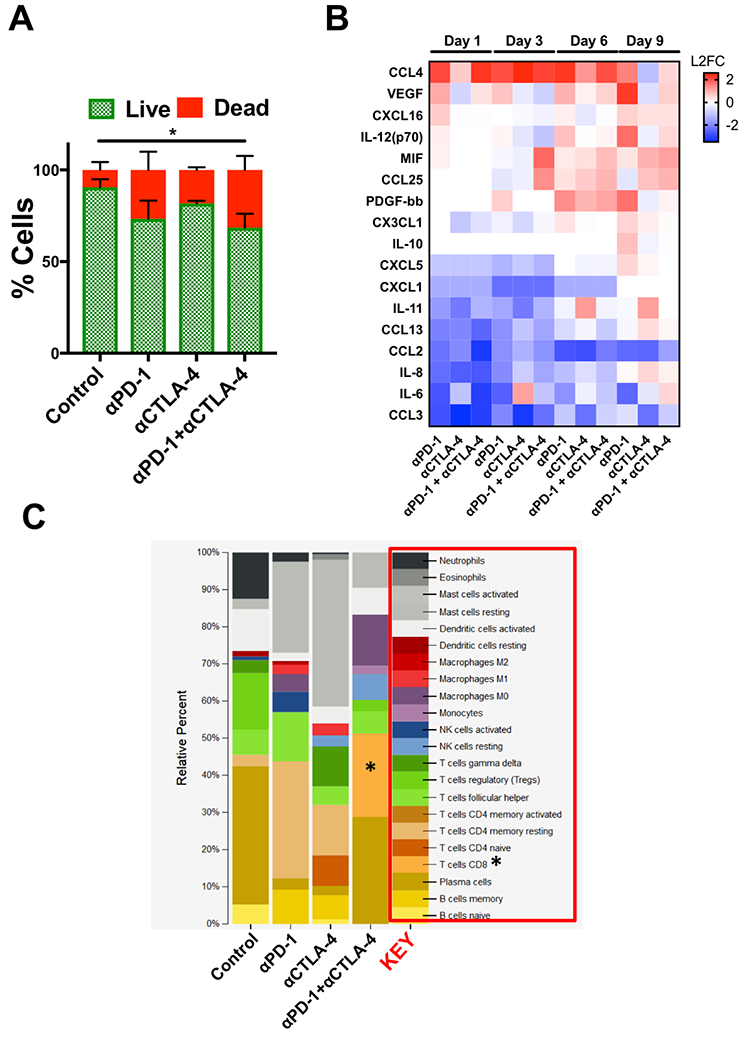
Figure 6 – Ex Vivo Profiling of ICB Using PDOTS.

(A), AO/PI staining of SI-NET PDOTS (Day 9) treated with αPD-1, αCTLA-4, and αPD-1 + αCTLA-4 compared to untreated control PDOTS. (B), Heatmap of changes in secreted cytokines from PDOTS (SI-NET); represented as L2FC relative to untreated control at each time point. (C), Inferred changes in PDOTS immune cell populations using CIBERSORT from SI-NET PDOTS RNA-seq.
