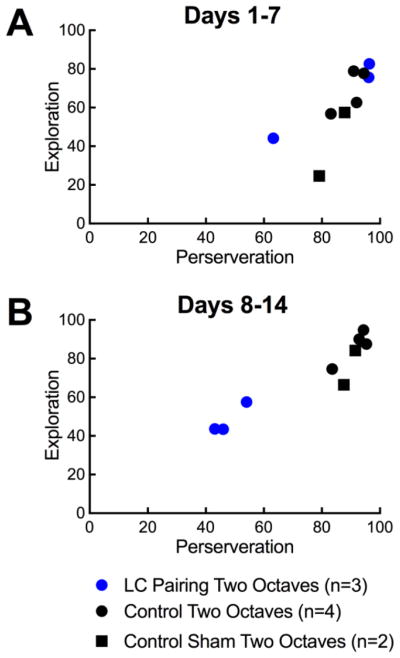
Figure 5.
Correlation of perseveration and exploration phases of reversal learning. A, The correlation between perseveration, quantified as responses (%) to the original target tone (4 kHz) and exploration, quantified as responses to all tones (%) for control animals (black circles), sham paired animals (black squares), and paired animals (blue circles) during the first week of reversal B, Same as A, but during the second week of reversal.

