
Fig. 5: Ultrasonic propofol uncaging in deep structures yields a unique functional connectivity signature.
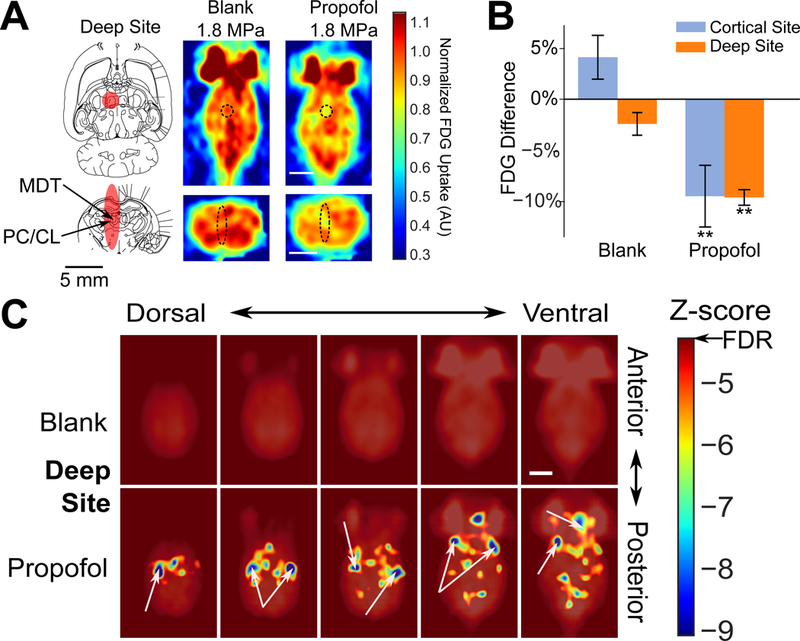
(A) Left: Deep sonication target FWHM (red) overlaid onto transverse (top: −5.6 mm ventral to bregma) and axial (bottom: −3 mm caudal to bregma) rat atlas sections (Paxinos and Watson, 2013). MDT: mediodorsal thalamus, PC/CL: paracentral/centrolateral nuclei of the thalamus. Right: Individual animal transverse (top) and axial (bottom) PET images obtained during sonication (60 × 50 ms bursts at 1 Hz burst frequency, 1.8 MPa peak in situ pressure; black dashed ellipse: expected sonication FWHM), following blank or propofol-loaded nanoparticle administration. Color bar represents FDG uptake, normalized against the average FDG uptake in the contralateral hemisphere. Scale bars: 5 mm. (B) Quantification of FDG avidity difference during sonication in the sonication field minus the contralateral non-sonicated field following blank or propofol-loaded nanoparticle administration for either cortical (repeated from Fig. 3 for ease of comparison) or deep target sonication. Presented are mean +/− S.E.M. for groups of N=6–7. **: p<0.01 by two-tailed t-tests. (C) Functional connectivity maps for deep target sonication of animals receiving blank or propofol-loaded nanoparticles. Unannotated map is provided in Fig. S4C. FC: Frontal cortex, LT: Lateral thalamus, TeA: Tegmental association area, I: Insula, O: Olfactory bulbs and cortex.