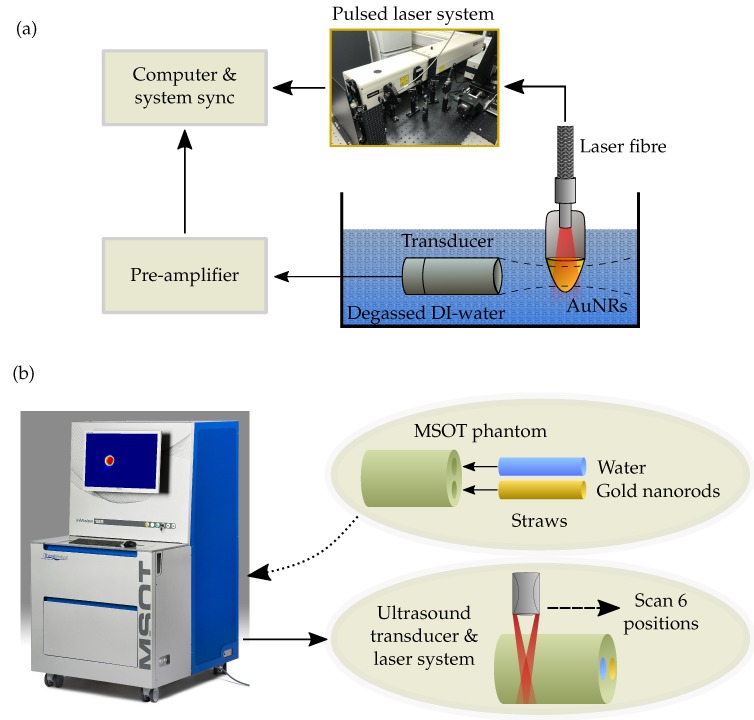
Figure 7.
(a) Schematic showing the experimental setup for measuring the PA response of the different sized AuNRs at a concentration of 1 × 10¹¹ NP/mL. (b) Experimental schematic showing a straw containing 1 × 10¹¹ NP/mL of AuNRs and another straw containing a water baseline being placed into a typical turbid, agar phantom before a multispectral scan is performed at 6 positions using the MSOT system.

