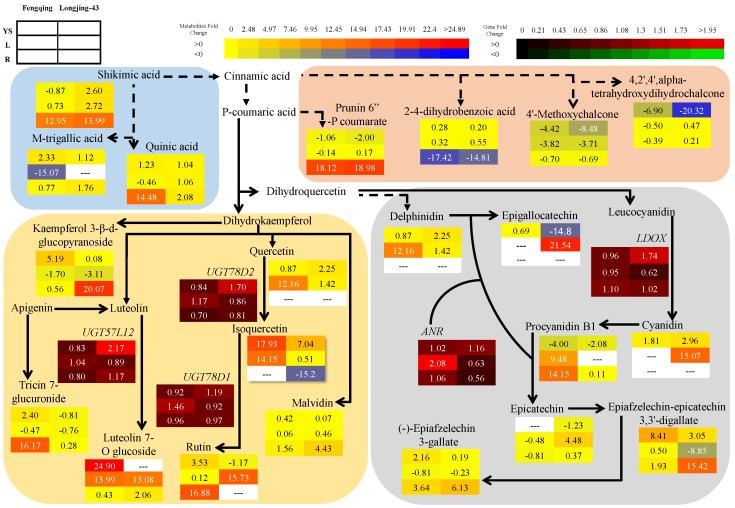
Figure 2.
Fold change (log2[−P/+P]) of secondary metabolites and metabolic genes in response to P starvation. Fengqing (left column) and Longjing-43 (right column) and from the top to the bottom rows are young shoots (first row), leaves (middle row) and root (button row). YS, L and R represents young shoots, leaves, and root, respectively. Metabolites and metabolic genes inside background color box represents different biosynthesis pathway. The solid arrow shows direct and dotted arrow represents speculated steps in the pathway. The data depicted from Table S2 and Table 5, positive as increase and negative as decrease in fold change. On the false color scale red indicates increase; blue and green indicates decrease in metabolites and gene. ANR, anthocyanin reductase; LDOX, leucoanthocyanidin dioxygenase; UGT57L12, flavanol 7-O glycosyltransferase; UGT78D2, flavanol 3-O-glucosyltransferase 2; UGT78D1, flavanol 3-O-glycoside L-rhamnosyl transferase 1.

