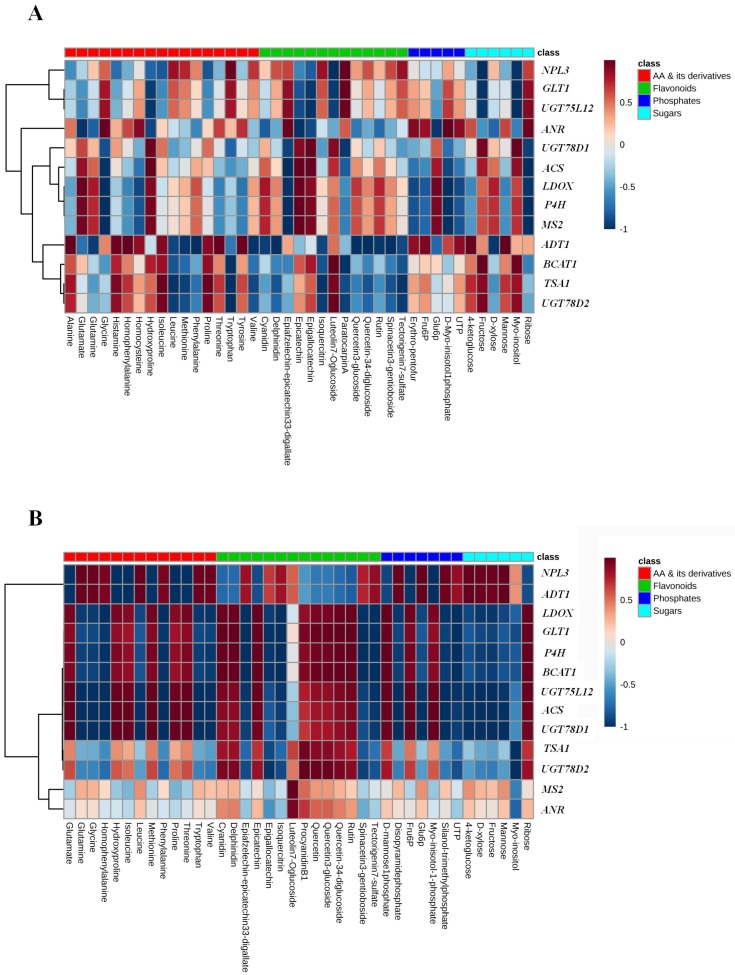
Figure 5.
Heat map of correlations between fold change (log2[−P/+P]) of selected significantly changed ( 0.05, t-test) metabolites and metabolic genes in young shoots. Red and blue colors indicate positive and negative coefficients and their scales indicate values of Fengqing (A) and Longjing-43 (B).

