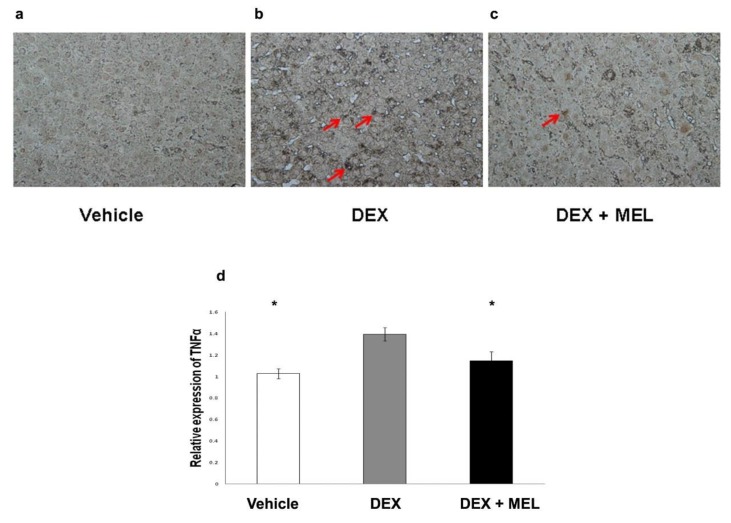
Figure 6.
The TNF-α immunohistochemistry showed (a–c) increased staining in the prenatal steroid compared with the control group and decreased in the melatonin group (original magnification ×400, red arrows: positive hepatocytes). (d) Semi-quantification of the TNF-α immunohistochemistry staining. All the results represent the mean ± standard error of six animals; * p < 0.05 when comparing with DEX group. The letters above each represented different groups with DEX representing the prenatal dexamethasone; DEX+MEL, melatonin treatment after prenatal dexamethasone.

