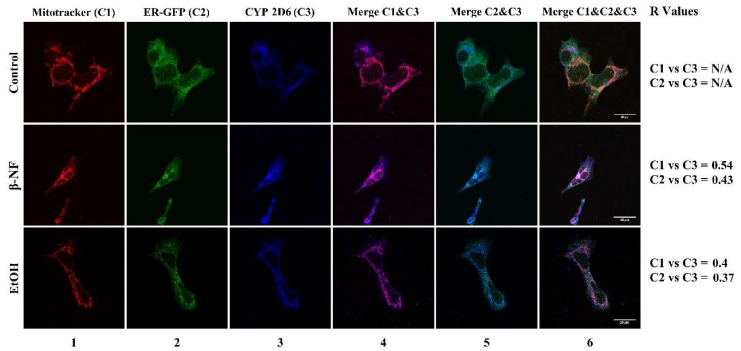
Figure 4.
Immunostaining of CYP2D6 in SH-SY5Y cells after β-NF and EtOH treatment. Representative immunofluorescence images of each experimental condition. Column 1 represents mitochondrial stain (red), column 2 represents ER-Green Fluorescent Protein (GFP) stain (green), and column 3 reports the CYP2D6 staining (blue). Column 4 represents the merge between CYP2D6 and mitochondria channel, column 5 represents the merge between CYP2D6 and ER-GFP, and column 6 represents the merge of the three channels. R Values: Pearson’s correlation coefficient. N/A: Not determined. Scale bars: 20 µm (control and EtOH) and 40 µm (β-NF).

