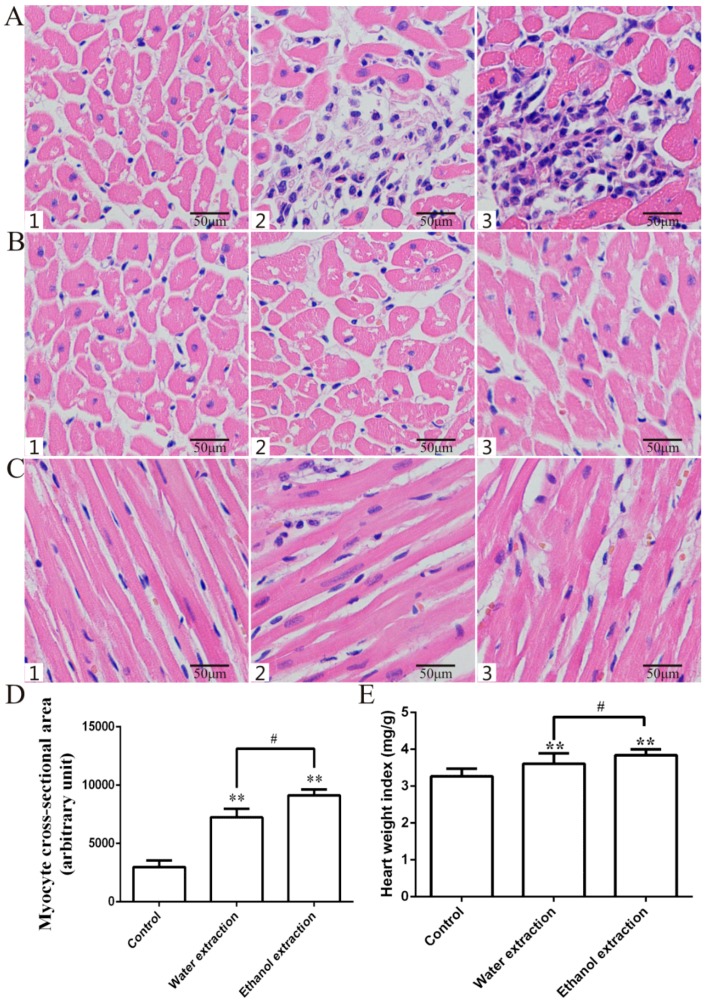
Figure 3.
Histopathological examination of heart, HW/BW, and myocyte CSA. (A,B) Representative figure of myocyte cross-section (hematoxylin-eosin staining (HE) staining, 400×); (D) Statistic results of myocyte CSA. 1: Control group; 2: Water extraction group; 3: Ethanol extraction group; (C) Representative figure of myocyte long axis (HE staining, 400×); (E) Statistic results of HW/BW; data are expressed as mean ± SD, n = 8. ** p < 0.01 vs. control group; # p < 0.05, vs. water extraction group.

