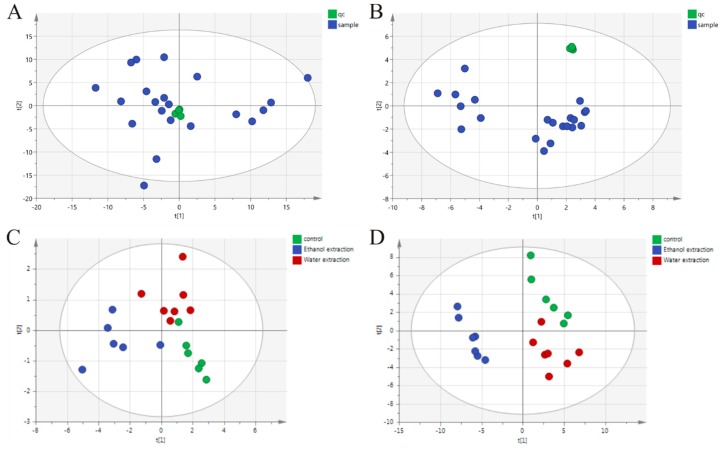
Figure 5.
Multiple pattern recognition of the serum metabolites in the control, water extract, and ethanol extract groups on day 7. (A) QC of reversed phase C18 separation. (B) QC of hydrophilic chromatogram separation. (C) Representative figure of reverse phase C18 column detection chart. (D) Representative figure of hydrophilic chromatogram. Control group (green), ethanol extraction group (blue), water extraction group (red).

