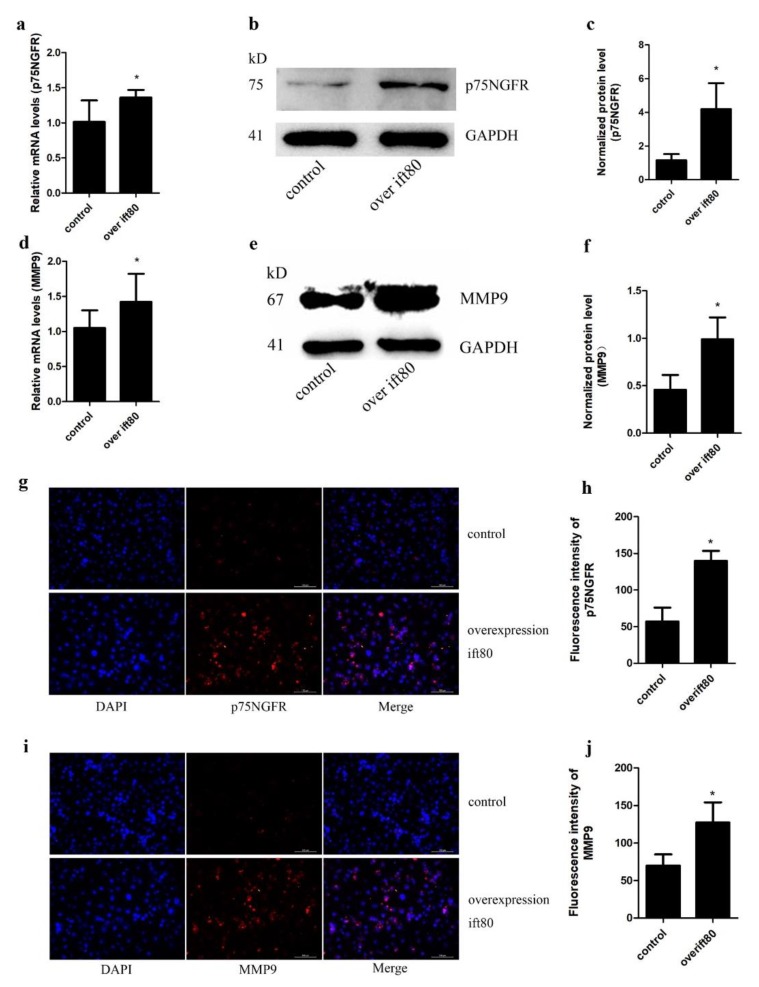
Figure 4.
Increased IFT80 expression increases the protein expression levels of p75NGFR and MMP9 in SGC-7901 cells. (a) qRT-PCR analysis of p75NGFR expression in control cells and IFT80-overexpressing cells. The expression of p75NGFR is normalized to GAPDH expression. (b) The expression of p75NGFR was evaluated by Western blot analysis. GAPDH was used as an internal control. (c) Quantitative analysis of p75NGFR protein levels from immunoblots in (b). The protein levels of p75NGFR were normalized to GAPDH. (d) qRT-PCR analysis of MMP9 expression in control cells and IFT80-overexpressed cells. (e) The MMP9 protein expression was assessed by Western blot analysis. (f) Quantitative analysis of MMP9 protein levels from immunoblots in e. The protein levels of MMP9 were normalized to GAPDH. (g) The expression of p75NGFR was assessed by immunofluorescence in control cells and IFT80-overexpressed cells. Cells are stained with anti-p75NGFR antibody (red) and nuclei were marked with DAPI (blue) (200×). (h) Quantification of the fluorescence intensity shown in (g). Data represent the mean ± SEM. N = 3. * P < 0.05, control vs. overexpression of ift80. (i). The expression of MMP9 was evaluated by immunofluorescence in control cells and IFT80-overexpressed cells. Cells are stained with anti-MMP9 antibody (red) and nuclei were marked with DAPI (blue) (200×). (j). Quantification of the fluorescence intensity shown in (i). (N = 3, * P < 0.05, control vs. overexpression of ift80).

