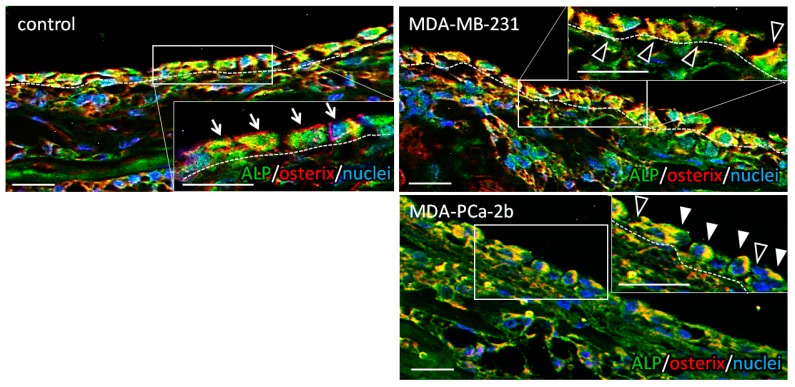
Figure 3.
Immunohistochemical images of the bone surface cultured without tumor cells (control), with breast cancer MDA-MB-231 cells, and prostate cancer MDA-PCa-2b cells. Insets show magnified images. Green; ALP (alkaline phosphatase), Red; osterix, Blue; nuclei. Arrows indicate the ordered osteoblasts in control. Black arrowheads show disrupted intercellular connection; white arrowheads indicate the abnormal morphology of osteoblasts. Dot lines indicate the bone surface. Scale bars: 20 µm.

