Figure 3.
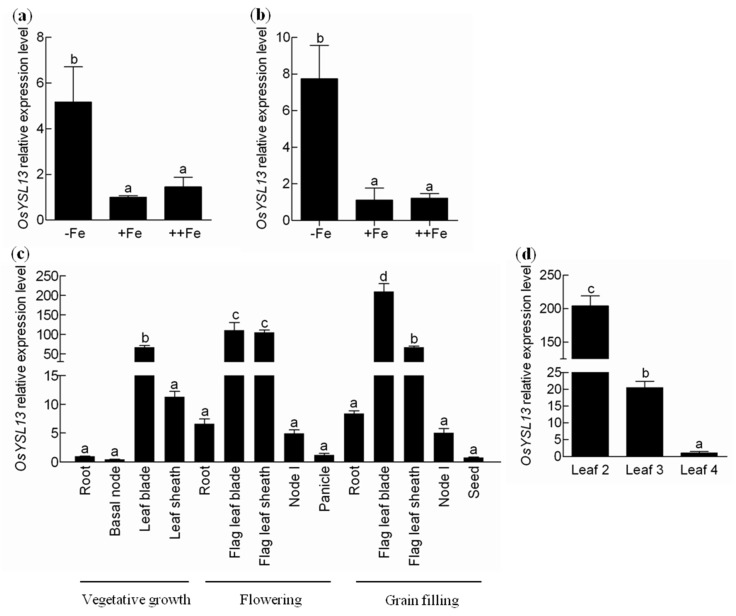
Expression analysis of OsYSL13. (a,b) Expression of OsYSL13 in the roots (a) and shoots (b) under different Fe concentrations. Plants were grown for 7 days in 1/2 Kimura B nutrient solution with different Fe concentrations. 0, 2, and 20 μM FeSO4 were used as − Fe, + Fe, and ++ Fe treatments, respectively. The roots and shoots were collected for analysis. Relative expression level of OsYSL13 was compared with the expression under normal nutrition condition (2 μM FeSO4). (c) Tissue-dependent expression of OsYSL13. Different tissues at the vegetative growth, flowering, and grain filling stages were sampled. Plants were grown in 1/2 Kimura B nutrient solution for 4 weeks and then transplanted to soil. Expression relative to the roots at the vegetative growth stage was shown. (d) Expression of OsYSL13 in the different leaves. Plants were cultured in normal nutrient solution for 7 days. Leaf 4 was the youngest leaf. Different leaves (from leaves 2 to 4) were sampled for analysis. Relative expression level of OsYSL13 was compared with the expression in leaf 4. The expression was determined by quantitative RT-PCR. OsActin1 was used as an internal control. Data were means ± SD (n = 3). Means with different letters were significantly different. Analysis of variance (ANOVA) with a subsequent Duncan′s test was performed (p < 0.05).

