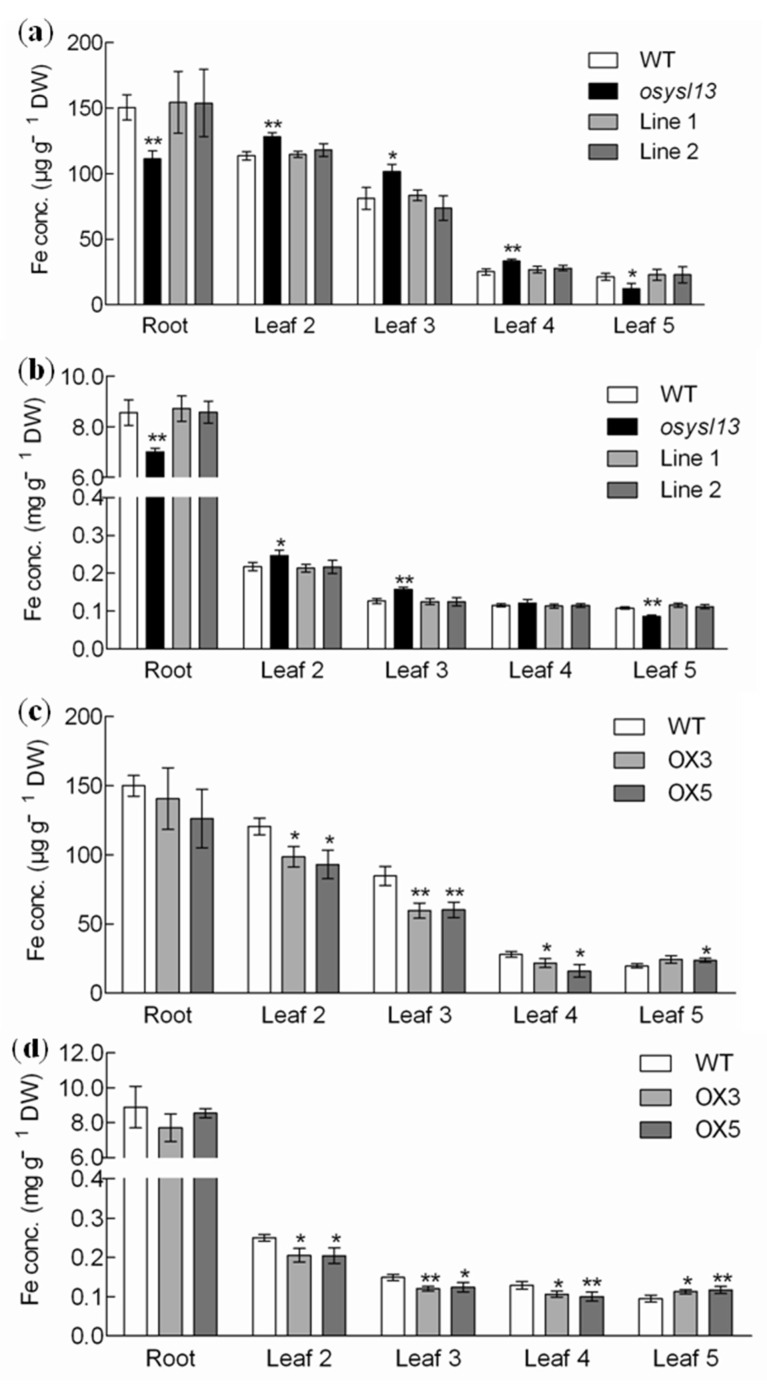
Figure 6.
Fe concentrations analysis at the vegetative stage. (a,b) Fe concentrations in the osysl13 mutant, wild type, and complementation lines during Fe deficiency (a) and sufficiency (b). (c,d) Fe concentrations in the OsYSL13 overexpression lines and wild type during Fe deficiency (c) and sufficiency (d). Plants were grown in nutrient solution with or without Fe for 10 days. The roots and different leaves were sampled for analysis. Fe concentrations were determined by inductively coupled plasma mass spectrometry (ICP-MS). Significant differences compared with the wild type were determined by ANOVA (* p < 0.05 and ** p < 0.01). Data were shown as means ± SD (n = 3). DW, dry weight. Conc., concentration.

