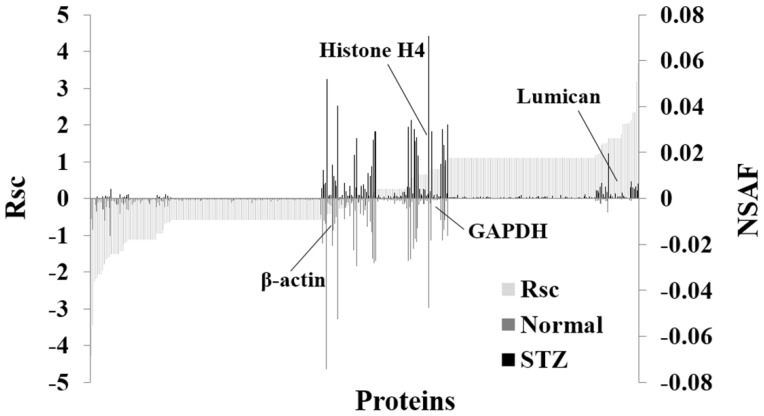
Figure 2.
Semiquantitative comparison of proteins differentially expressed in the cornea of the STZ rat. For the identified proteins, Rsc and normalized spectral abundance factor (NSAF) values were calculated to compare protein expression levels between the cornea of normal rat (Normal) and that of the STZ rat (STZ). Proteins are positioned along the x-axis according to Rsc value, increasing from left to right (light gray area). NSAF values are shown for the Normal group (below the axis; gray bar) and for the STZ group (above the axis; black bar). Proteins highly expressed in the Normal and STZ groups are near the left and right sides, respectively of the x-axis. Housekeeping proteins are located around the center of the x-axis.

