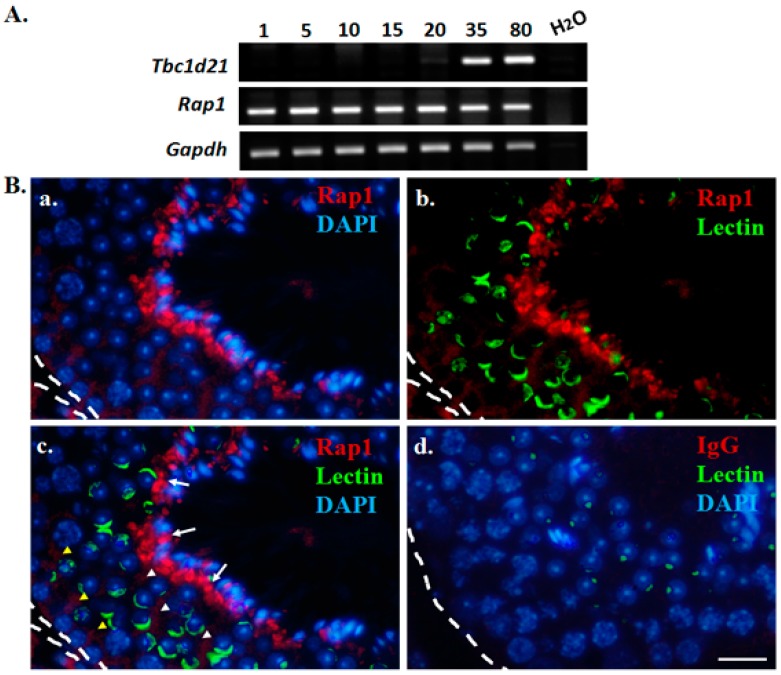
Figure 3.
Expression patterns of Rap1 during murine spermatogenesis. (A) Expression patterns of Rap1 and Tbc1d21 transcripts in the mouse testes of different postnatal days, determined by RT-PCR. Gapdh was the loading control. (B) Localization of Rap1 in testicular sections of an adult (80 days old) mouse, as determined through an immunofluorescence (IF) assay. Anti-Rap1 (a–c) or mouse IgG (d) antibodies (red); acrosomal marker (green; b,c); 4′,6-diamidino-2-phenylindole (DAPI) (blue; a, c, and d); merging of Rap1 and DAPI (a); merging Rap1 and acrosomal marker (b); merging of Rap1, acrosomal marker, and DAPI (c); merging of mouse IgG control, acrosomal marker, and DAPI (d). Scale bar: 20 μm. The discontinuous white line marks the edge of the seminiferous tubules within the murine testicular tissue. Yellow arrowheads: Rap1 signals in spermatogonia, spermatocytes, and round spermatids; White arrows: Rap1 signals around the heads of elongating spermatids.

