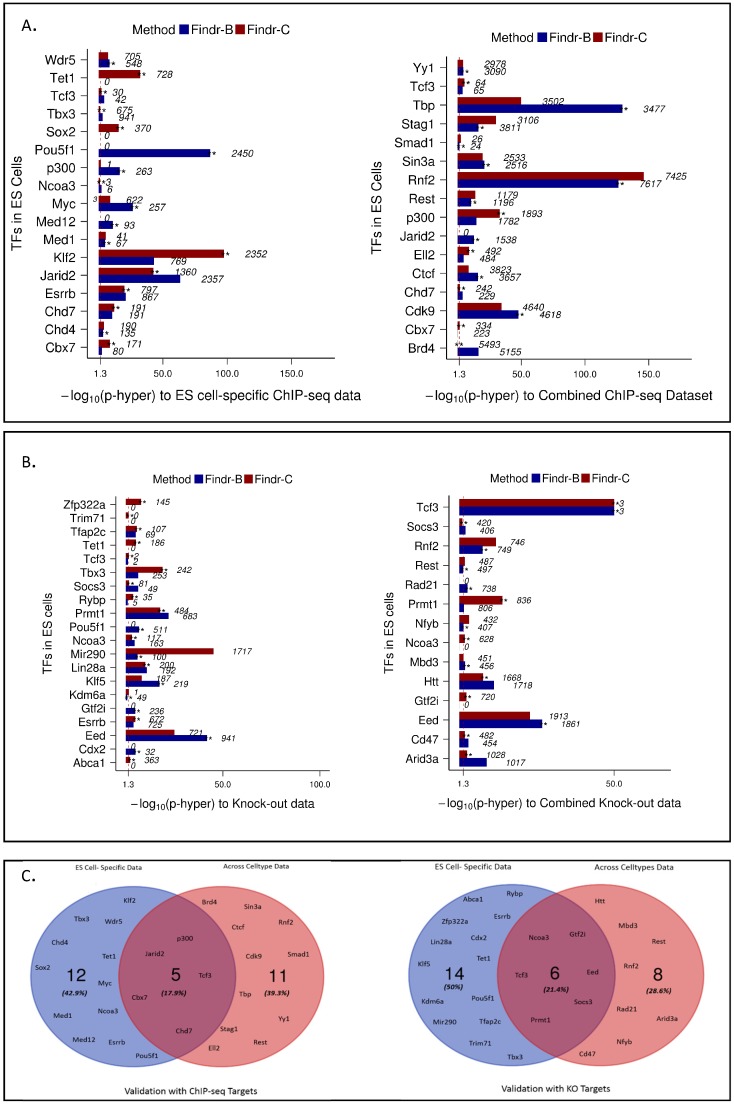
Figure 4.
Comparison of Findr-adaptive (A) predictions using mouse ES cells and all cell types samples. (A) Bar plots representing enrichments for Findr-B, -C and -A predictions using ChIP-seq data as a validation dataset for ES cells (left) and all cell types (right). (B) Bar plots representing enrichments for Findr-B, -C and -A predictions using knock-out data as a validation dataset for ES cells (left) and all cell types (right). (C) Overlap of factors between ES and all cell types using ChIP-seq (left) and knock-out (right) as validation datasets.

