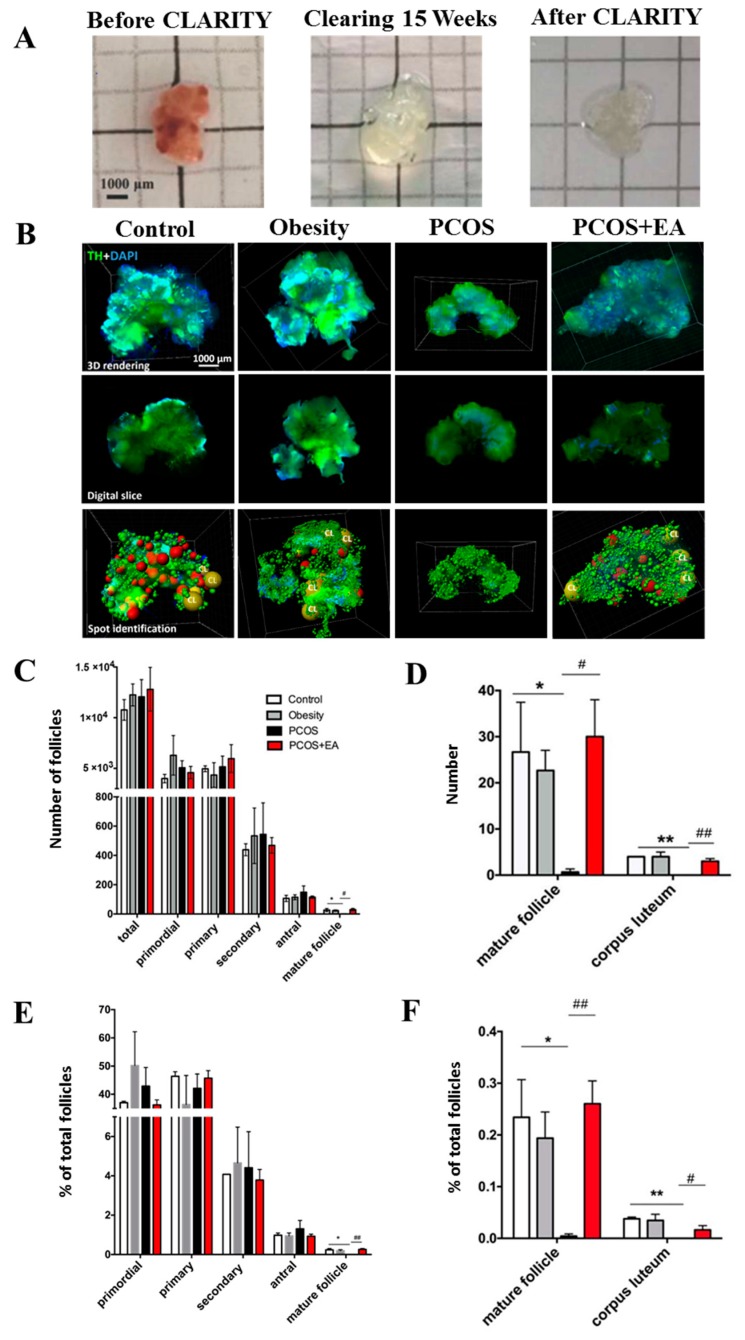
Figure 2.
CLARITY shows that EA increases the numbers of mature follicles and Cl in the ovaries from PCOS-like rats. (A) The clarification process of a rat ovary. (B) Ovaries from rats in the different groups after CLARITY processing and immunostaining using specific antibodies followed by data transformation using the Imaris Spot algorithm. Upper panels: 3D rendering of whole ovary images; middle panels: digital slices showing follicles at individual planes; lower panels: Data transformation into spot graphs following the identification of follicles using specific markers. Background staining using tyrosine hydroxylase antibodies provided outlines for the identification of all follicles. Red spots represent preovulatory follicles. CL, corpus luteum. (C) The numbers of follicles at different developmental stages in the different groups. (D) The numbers of mature follicles and corpora lutea. (E) The ratio of the different follicle stages in each group. (F) The ratio of mature follicles and CL. * p < 0.05 and ** p < 0.01 vs. the Control group; # p < 0.05 and ## p < 0.01 vs. the PCOS group.

