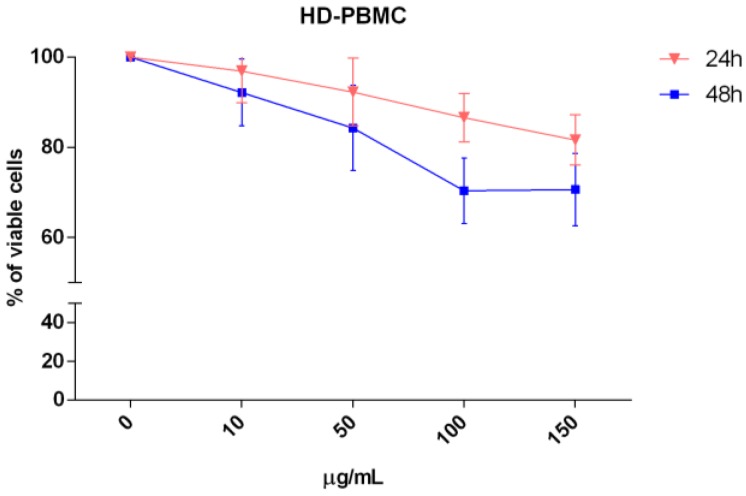
Figure 5.
Analysis of five HD-PBMC viability after treatment with different concentrations (10, 50, 100, and 150 μg/mL) of AG CHCl3 fraction for 24 and 48 h. Results are expressed as percent of cell viability normalized to DMSO-treated control cells. The line-graphs represent the average with standard deviation from five healthy subjects.

