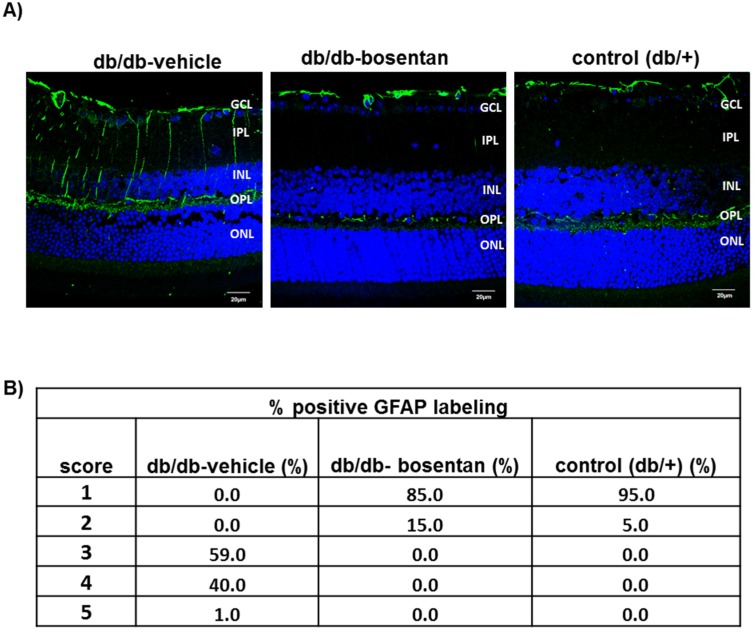
Figure 3.
Glial activation. (A) Comparison of glial fibrillary acidic protein (GFAP) immunofluorescence (green) between representative samples from a db/db mouse treated with vehicle, a db/db mouse treated with bosentan and a non-diabetic mouse. In the diabetic mouse treated with vehicle, the Müller cells’ endfeet show abundant GFAP immunofluorescence and the radial processes stain intensely throughout both the inner and outer retina. Nuclei were labeled with DAPI (blue). GCL: Ganglion cell layer; IPL: Inner plexiform layer; INL: Inner cell layer; OPL: Outer plexiform layer; ONL: Outer nuclear layer; (B) Quantification of glial activation based on extent of GFAP staining. n = 6 mice per group (10 sections per retina).

