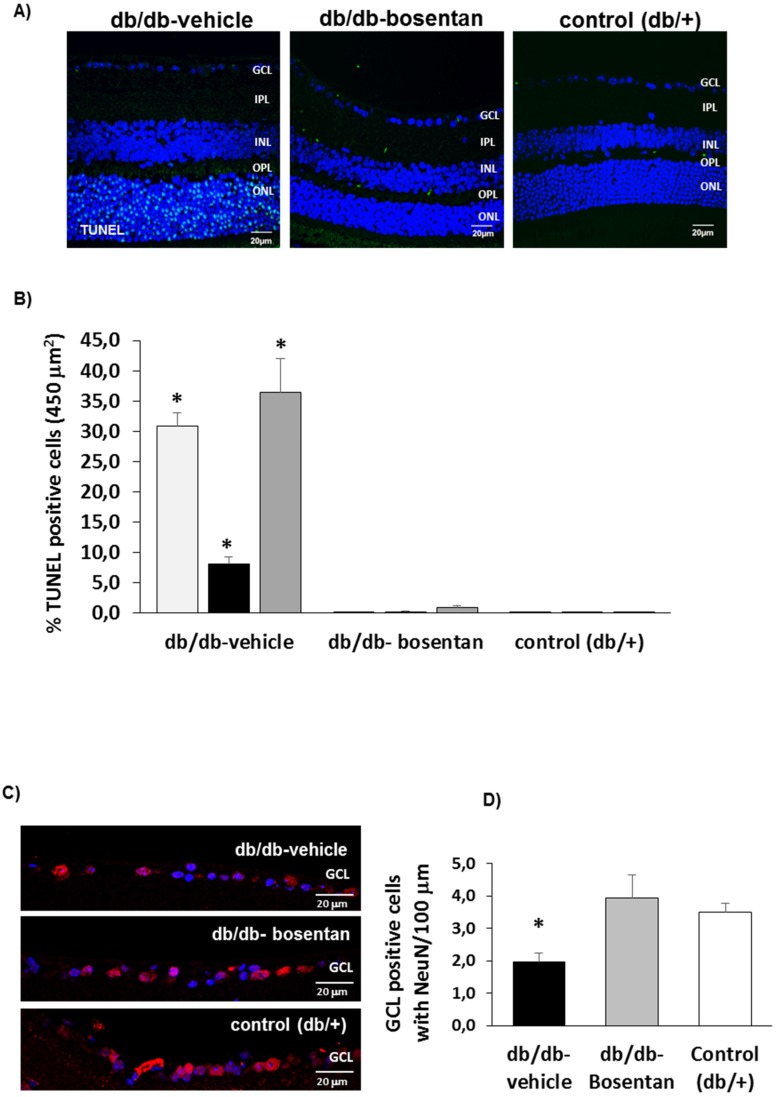
Figure 4.
Apoptosis. (A) Comparison of TUNEL immunofluorescence (green) between representative samples from a db/db mouse treated with vehicle, a db/db mouse treated with bosentan and a non-diabetic mouse. Scale bar: 20 µm; (B) Percentage of TUNEL positive cells in the retinal layers. * p < 0.001 in comparison with the other groups in all retinal layers (ONL, INL and GCL). n = 6 mice per group (10 sections per retina); (C) Comparison of NeuN positive cells (red) between representative samples from a db/db mouse treated with vehicle, a db/db mouse treated with bosentan and a non-diabetic mouse. Nuclei were labeled with DAPI (blue). Scale bar: 20 µm; (D) Quantification of NeuN positive cells. * p < 0.05 when compared db/db mice treated with vehicle and either db/db mice treated with bosentan and non-diabetic mice.

