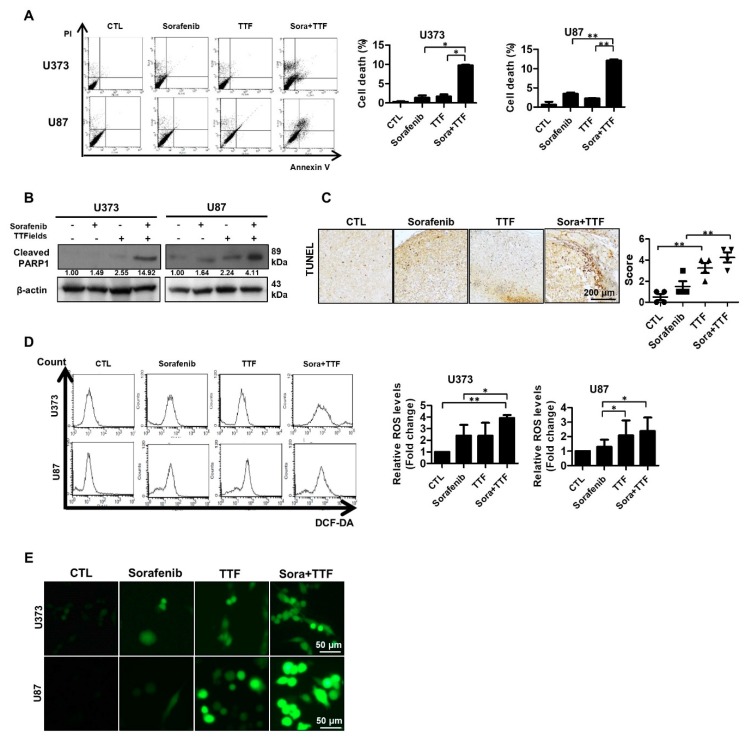
Figure 3.
Effects of sorafenib and tumor-treating fields (TTFields) on apoptosis in glioblastoma cells. (A) U373 and U87 cells were exposed to sorafenib (5 µmol/L) and/or TTFields for 48 h prior to annexin V/PI staining; (B) cell lysates (30 µg) were immunoblotted with antibodies against cleaved PARP1 and β-actin; Band intensities were quantified and normalized to actin intensities (n = 3, mean ± SD). (C) terminal deoxynucleotide transferase-mediated dUTP nick-end labeling assays were performed using xenografts, n = 4; Solid circle: Control; Solid square: Sorafenib; Triangle: Tumor treating fields; Inverted triangle: Sorafenib+TTF. (D,E) U373 and U87 cells were treated with sorafenib, TTFields, or the indicated combinations, and reactive oxygen species (ROS) levels were determined using 2′,7′-dichlorofluorescein diacetate (a peroxide-sensitive dye), flow cytometry, and confocal laser fluorescence microscopy. Data are expressed as % of control and are means ± SD from 3 experiments. * p < 0.05; ** p < 0.01.

