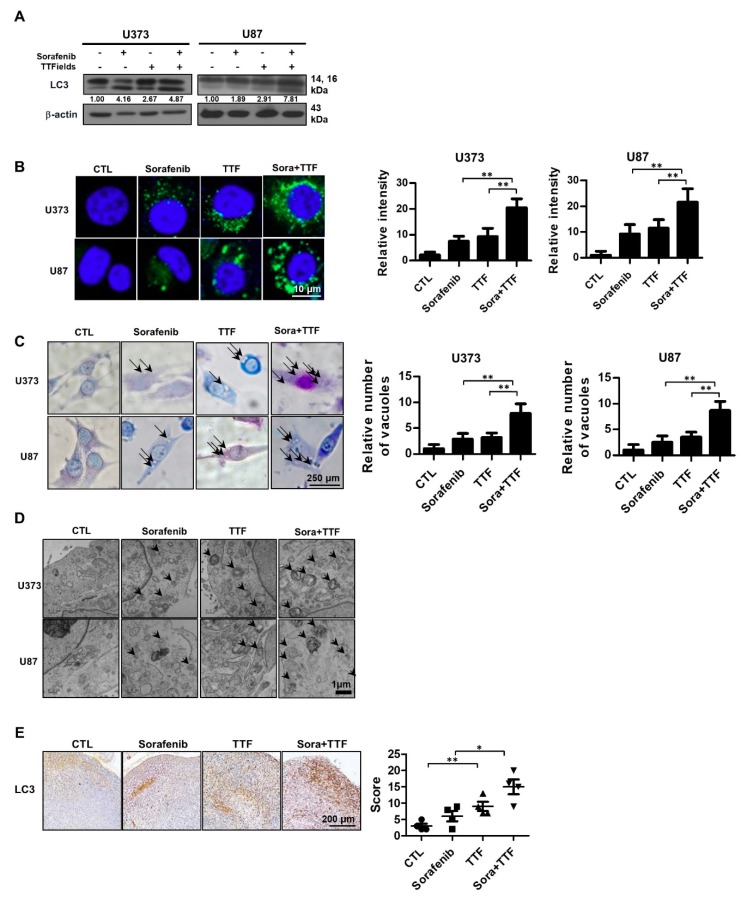
Figure 4.
Combinatorial treatment with sorafenib and tumor-treating fields (TTFields) induces autophagy in glioblastoma cancer cells. (A) cell lysates (30 µg) were immunoblotted with anti-LC3 and anti-β-actin antibodies; Band intensities were quantified and normalized to actin intensities (n = 3, mean ± SD). (B) cyto-ID staining of U373 and U87 cells with and without sorafenib or with and without TTFields treatment. ** p < 0.01; (C) cells were stained with Giemsa stain (10% in phosphate-buffered saline), washed, and imaged using a Leica DM IRB light microscope (magnification, 40×). Black arrows indicate vacuoles. ** p < 0.01; (D) autophagy was assessed by transmission electron microscopy in cells, bar = 1 µm; black arrow: autophagic vacuoles. (E) LC3 expression in xenografts was examined by immunohistochemistry. Representative images are presented. * p < 0.05; ** p < 0.01; n = 4; Solid circle: Control; Solid square: Sorafenib; Triangle: Tumor treating fields; Inverted triangle: Sorafenib+TTF.

