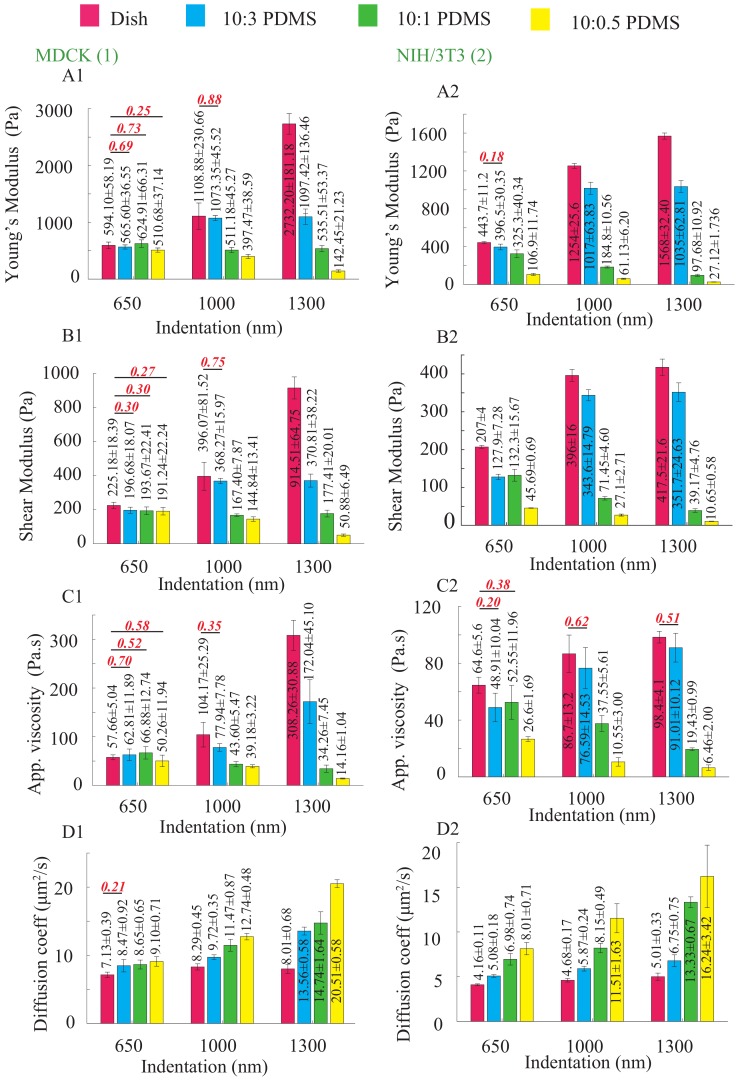
Figure 1.
The nonlinear cellular: (A1,A2) Young’s modulus; (B1,B2) shear modulus; (C1,C2) apparent viscosity; and (D1,D2) diffusion coefficient of MDCK and NIH/3T3 cells seeded on different substrate, respectively, quantified at different indentation depths at the indenting velocity of 20 μm/s. The AFM measurements were performed on six different cells at each indentation depth and the error bars represent the standard errors. n = 6. Student’s t-test was performed to analyze the statistical difference: for each indentation, data were compared with respect to the ones measured on the dish (control) at the same indentation; and for each substrate, the data measured at the minimum indentation (650 nm) for that substrate were chosen as control. A p < 0.05 was yielded for each comparison, unless otherwise denoted in the figure (with p values in red bold italic font).

