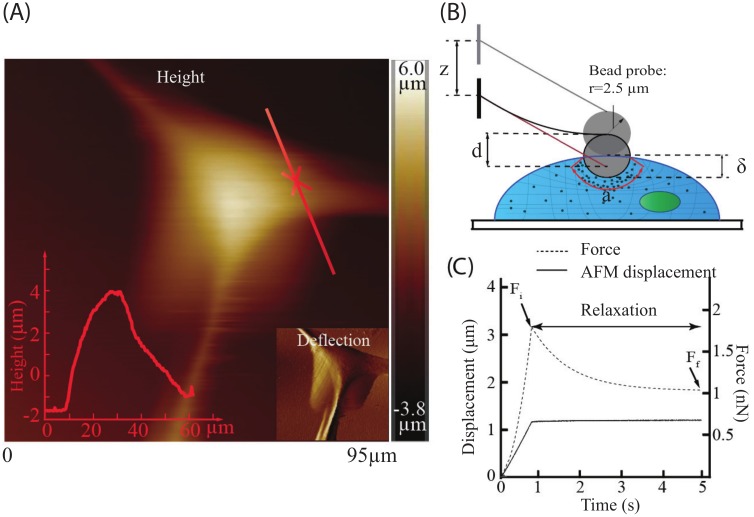
Figure 5.
(A) AFM topography image of an MDCK cell, where the red cross represents the measurement site. (B) AFM measurement of the cells with a sphere probe (radius 2.5 μm), where the area in red represent the probe–cell contact size. (C) The probe–cell interaction force and AFM displacement (z) profile during the force–relaxation process, where is the probe–cell interaction force at the beginning of the relaxation process (i.e., the end of the indenting process), and is the force at the end of the relaxation process.

