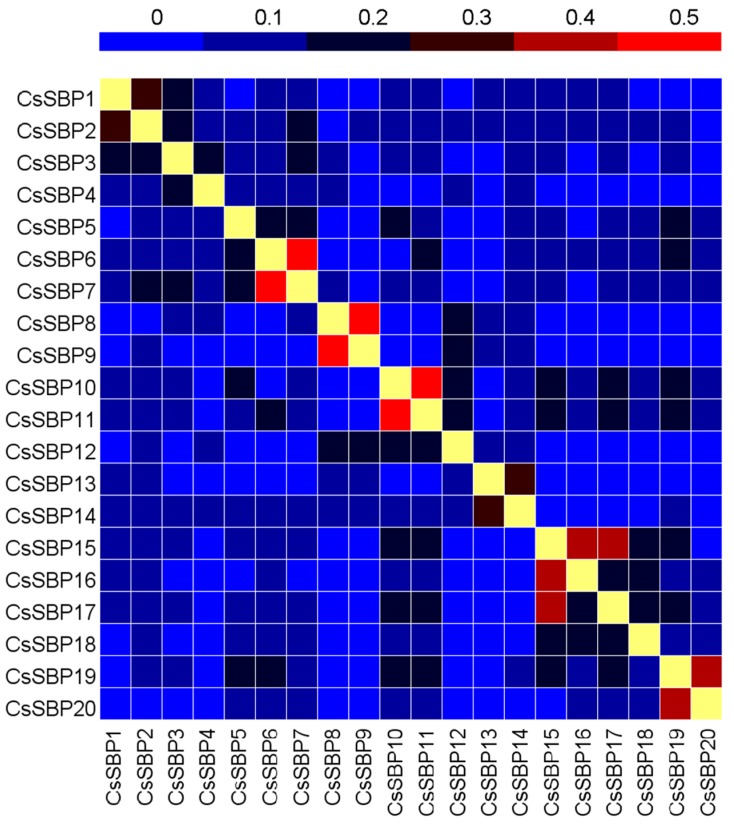
Figure 1.
The percentage identity matrix of CsSBP proteins. The heatmap was conducted based on the CsSBP protein sequences. The colored bar indicates the correlation of protein sequences of two genes, blue represents a low correlation, red represents a high correlation, and yellow represents a correlation that is 1. The correlated values of the CsSBP proteins are listed in Table S2.

