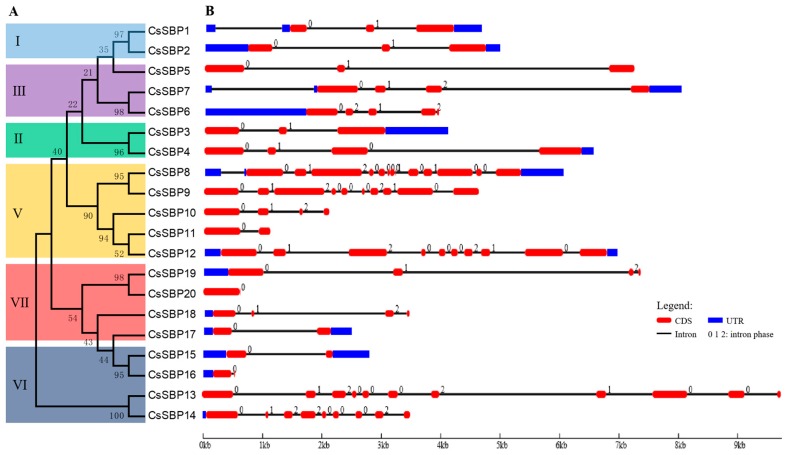
Figure 4.
Phylogenetic tree of the CsSBP gene family and the exon-intron structures of tea plant SBP proteins. (A) The phylogenetic tree of the CsSBP genes was created using the MEGA 5.0 software with the neighbor-joining method; bootstrap values from 1000 replicates are indicated at each node. (B) Exon-intron structures were described using GSDS 2.0. Red, round-cornered rectangles represent exons, black lines represent introns, and blue rectangles represent untranslated regions (UTRs). The numbers 0, 1, and 2 represent intron phases.

