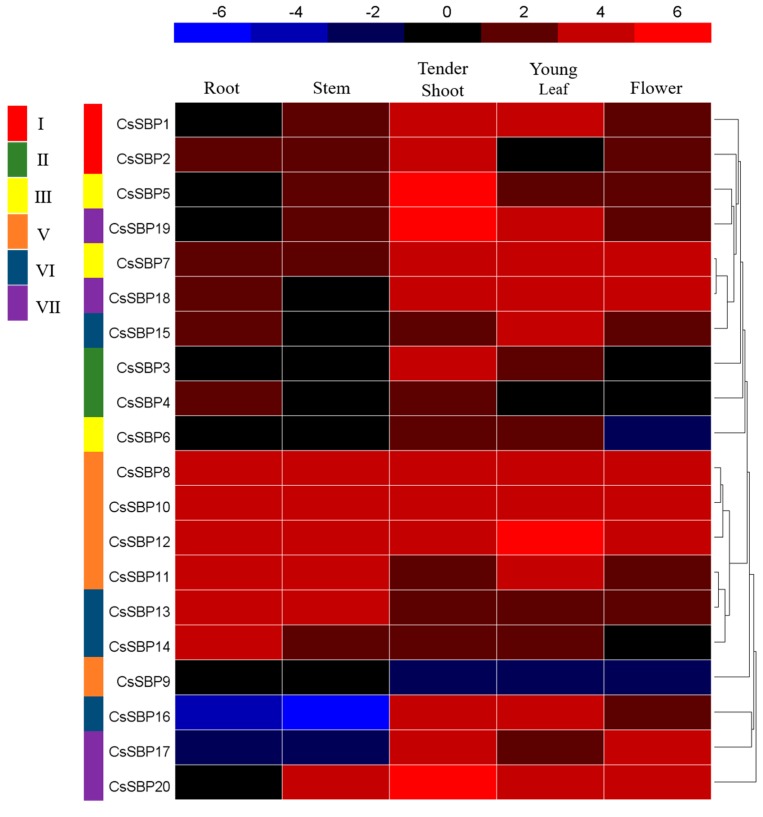
Figure 7.
Expression profiles of CsSBP genes in different tissues. The colored bar represents the expression values [log2(FPKM)]. Blue represents low expression, and red represents high expression. Different groups of CsSBP genes are marked with rectangles of different colors. The FPKM values of the CsSBP genes in different tissues are listed in Table S5.

