Figure 3.
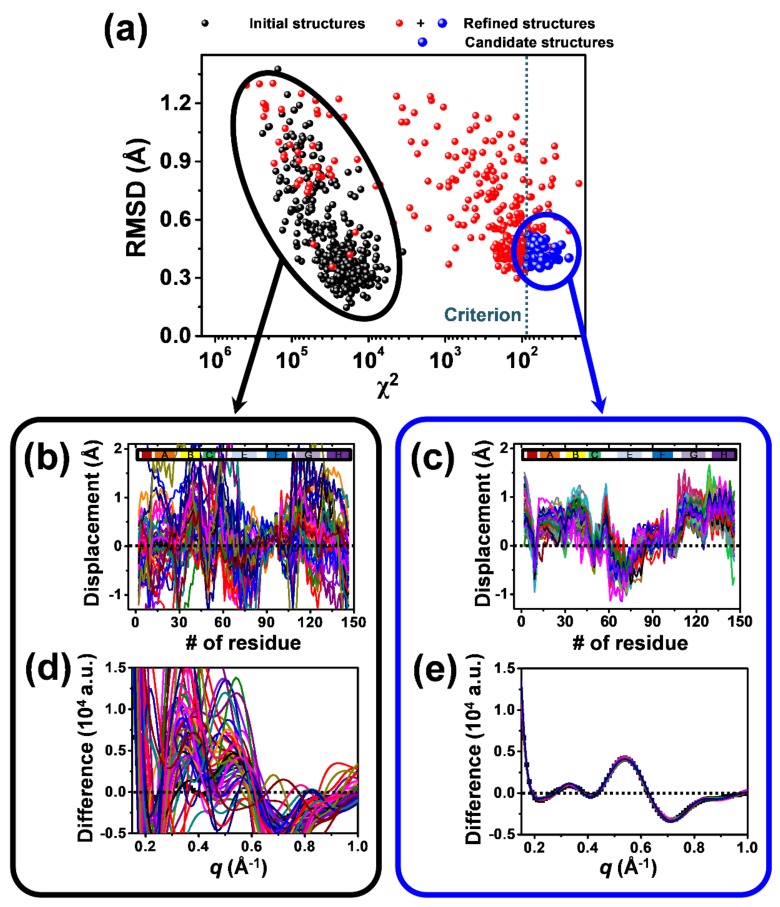
The structure refinement performed for the I3 intermediate of WT HbI (see Section 2.3) is shown as an example. Starting from 360 random initial structures generated by Monte Carlo simulations, we minimized the χ2 value, which is the degree of discrepancy between the experimental curve and the theoretical curve calculated from one of the starting structures, by exploring the structural space via Monte Carlo simulations guided by molecular dynamics (MD) force fields and simulated annealing. (a) The root mean square deviation (RMSD) for the initial structures (black dots) and the refined structures (red and blue dots) with respect to an arbitrary reference structure, which is the crystal structure of WT deoxy HbI (PDB ID: 4sdh) in this case, are plotted as functions of the χ2 values between the experimental curve and the theoretical curves. The best-refined structures (blue dots) are considered as the candidate structures. (b,c) Displacement plots for (b) 50 arbitrary structures chosen from among the 360 initial structures and (c) the 76 candidate structures. The displacement was calculated with respect to the crystal structure of WT HbI(CO)2 (PDB ID: 3sdh). Helices are indicated at the top of the plots. (d,e) Comparison of the experimental species-associated scattering curve with the theoretical scattering curves of (d) the 50 arbitrary structures and (e) the 76 candidate structures.

