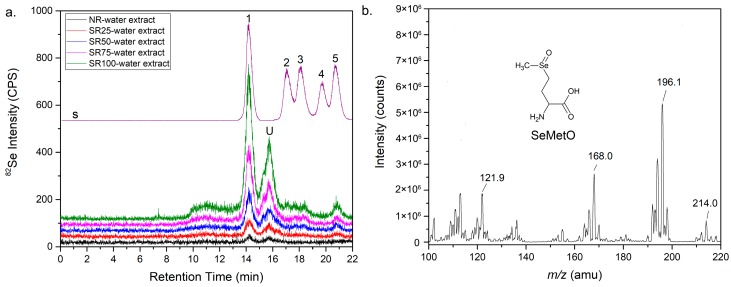
Figure 2.
Profiles of standard blend (violet line. s) of selenate (1), selenite (2), SeCys2 (3), MeSeCys (4), and SeMet (5) at 100 ng Se mL−1 and water extract of rice obtained by HPLC-ICP-MS (a). Identification of unknown peak corresponding to component eluted from water extract by ESI mass spectroscopy (b).

