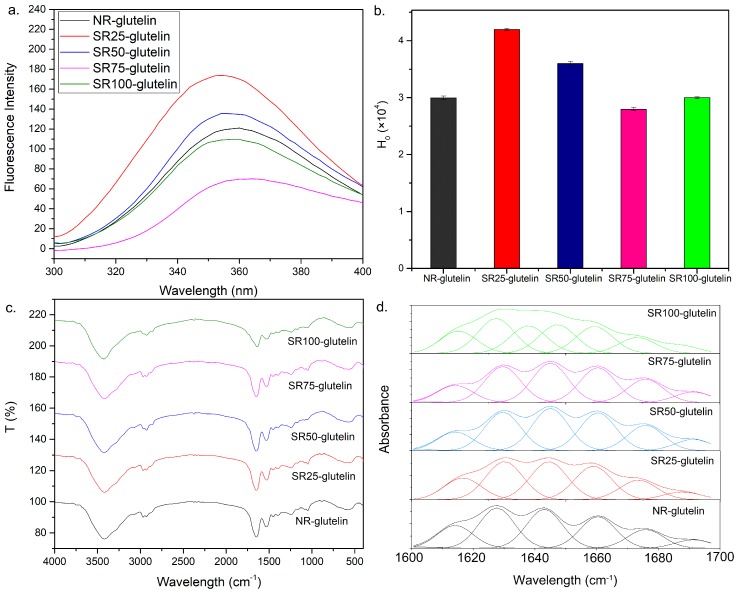
Figure 4.
Intrinsic fluorescence (a), H0 of Se-containing glutelin fraction from different plant groups (b), FT-IR analysis of Se-containing glutelin fraction from different plant groups (c), and deconvoluted FT-IR spectra and curve fitting of glutelin fraction in the wavelength range of 1600–1700 cm−1 (d).

