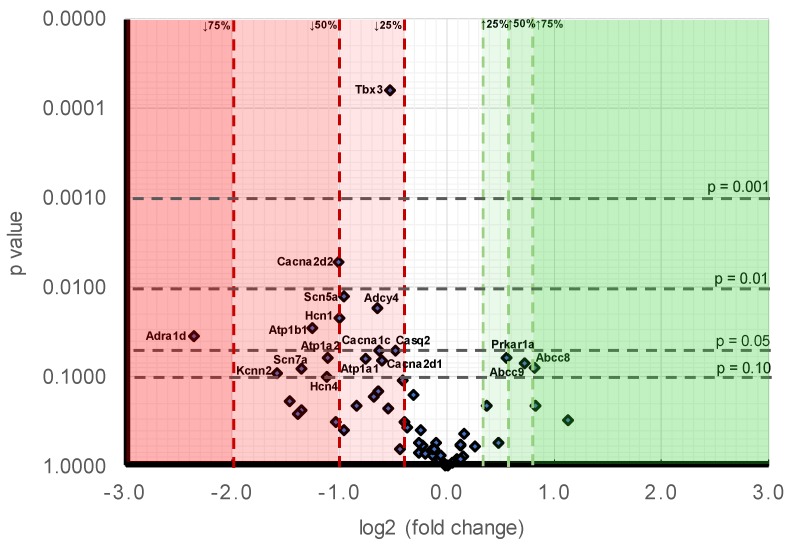
Figure 1.
Volcano plot comparing stratified statistical significances in expression levels and mean gene -fold changes in Pgc-1α−/− compared to WT atria for the collection of genes surveyed here. Horizontal stratifications correspond to probability levels p < 0.001, 0.001 < p < 0.01, 0.01 < p < 0.05 and 0.05 < p < 0.1 respectively. Ordinates stratify effect sizes indicating decreases/increases of 25%, 50%, and 75% respectively. Points falling within this stratification are labelled with the gene.

