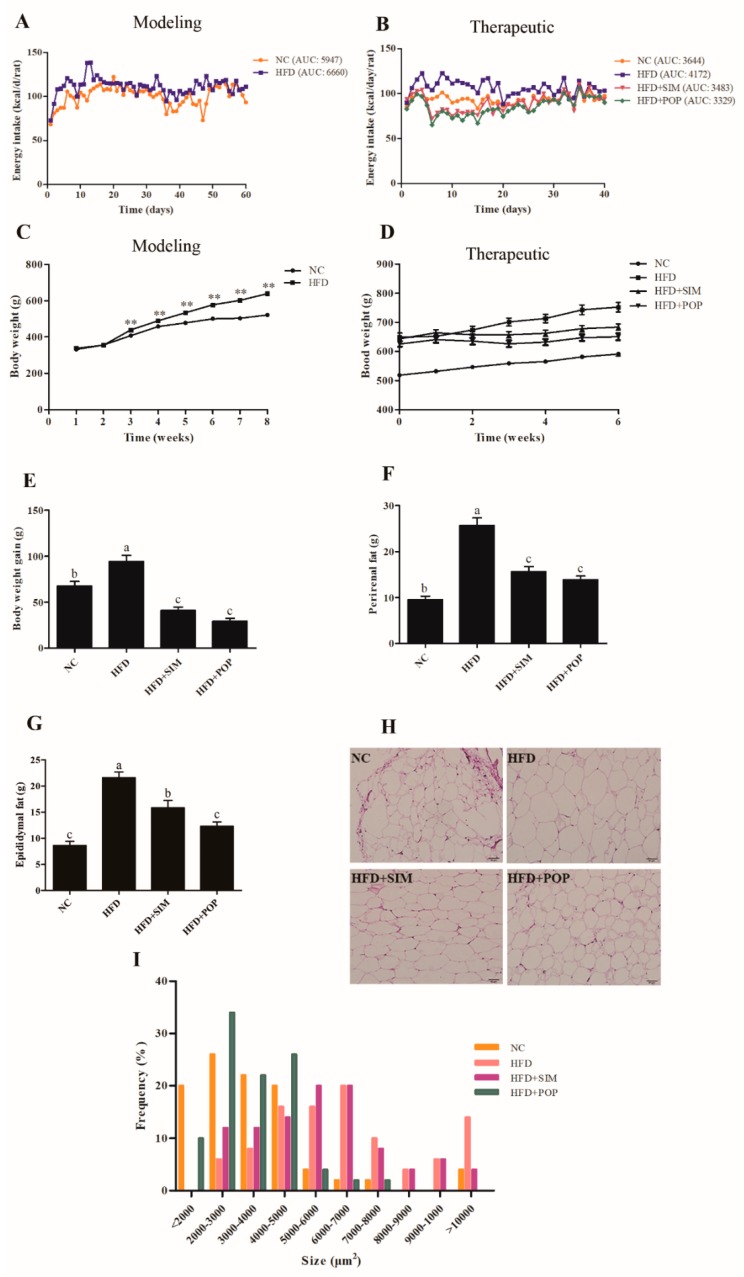
Figure 1.
Effects of POP on HFD-induced obesity in rats. (A) Energy intake during modeling time. (B) Energy intake during treatment. (C) Body weight during modeling time. (D) Body weight during treatment. (E) Body weight gain during treatment. (F) Perirenal fat. (G) Epididymal fat. (H) Epididymal adipocyte microsections. (I) Epididymal adipocyte size evaluated by ImageJ software. NC = normal control, HFD = high-fat diet, HFD + SIM = HFD with simvastatin (1.8 mg/kg), HFD + POP = HFD with P. odoratum polysaccharides (400 mg/kg). AUC = Area under curve. All data are presented as means ± SEM. ** p < 0.01 for HFD (n = 30) versus NC (n = 10) in (C). a–c Mean values not sharing a common superscript were significantly different among the groups (n = 10 for each) (p < 0.05).

