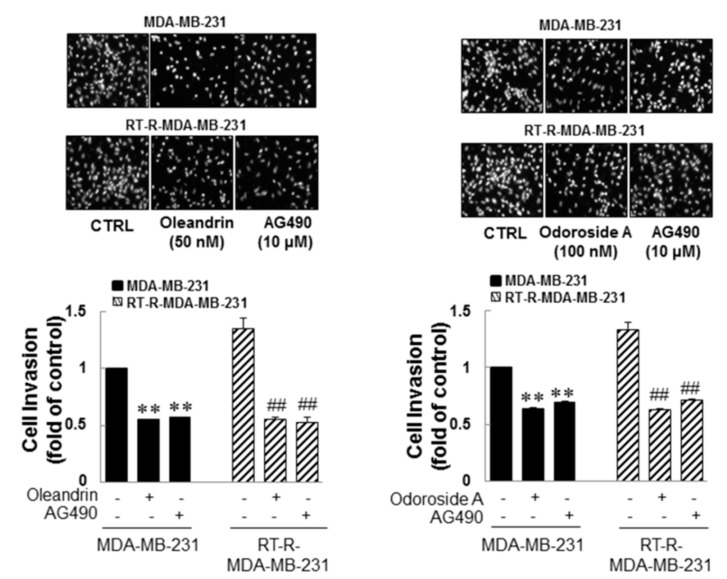
Figure 6.
Anticancer effects of oleandrin and odoroside A in MDA-MB-231 and RT-MDA-MB-231 cells through the downregulation of phospho-STAT-3. MDA-MB-231 and RT-MDA-MB-231 cells were treated as described in Figure 5, and then the cells were collected and added to ECs-Matrigel-coated insert wells. The cells were incubated overnight (for 16 h) at 37 °C, and then the cells that had invaded across the membrane were stained with DAPI and counted as described in Figure 3 (×200 field image). The values are expressed as the means ± SEM from three independent determinations. ** p < 0.01 compared with the MDA-MB-231 control group; ## p < 0.01 compared with the RT-R-MDA-MB-231 control group.

