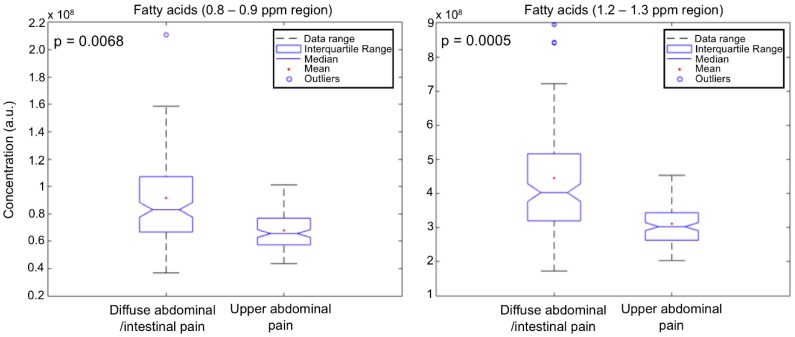
Figure 3.
Boxplots and calculated probability values (p) from Kruskal–Wallis non-parametric analysis of variance test of the most weighted variables (metabolites’ NMR signals) for the two group of diseases classification. Boxplots depict the concentration (in arbitrary units, a.u.) of some of the weighted metabolites for the groups classification. The analysis was performed after integration of the NMR signals of the weighted metabolites from the serum CPMG spectra.

