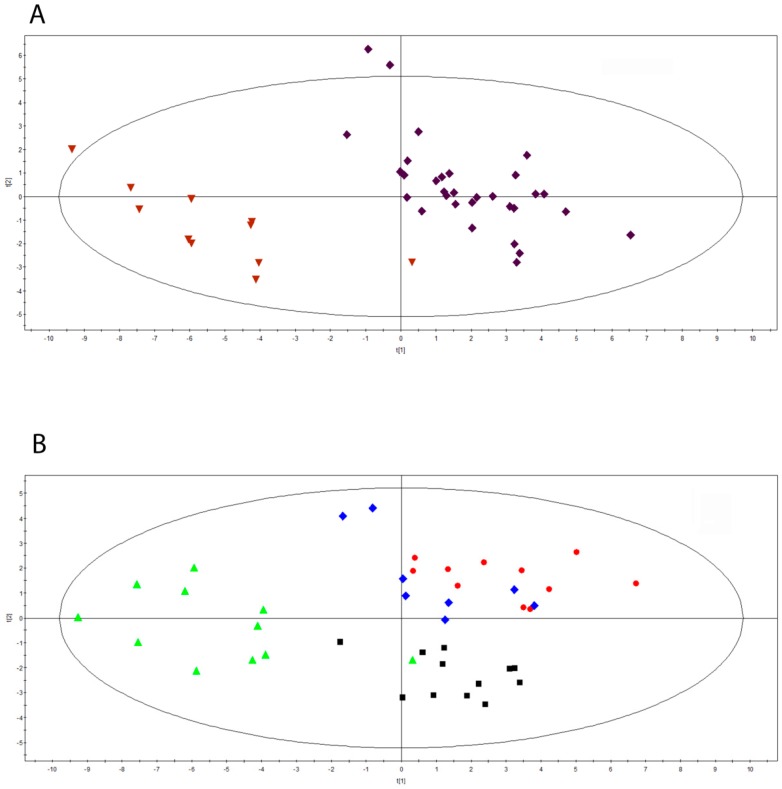
Figure 1.
(A) Scores scatter plot calculated on two components by using 42 observation of 12 MuS cases, divided into two time groups: during pregnancy and post-partum. The classification is based on each metabolite concentration, excluding steroids and estrogens. The Partial Least Squares Discriminant Analysis (PLS-DA) was used to classify sera from MuS patients in each time group as follow: purple diamonds: during pregnancy; dark red inverted triangles: post-partum obtained by R2Y = 0.865 and Q2(cum) = 0.758. (B) Scores scatter plot calculated on two components by using 42 observations divided into three different times of pregnancy and the post-partum period. classification is based on each metabolite concentration, excluding steroids and estrogens. The Partial PLS-DA was used to classify sera from MuS patients in each time group as follow: black boxes: first trimester of pregnancy; red dots: second trimester of pregnancy; blue diamonds: third trimester of pregnancy; green triangles: post-partum obtained by R2Y = 0.484 and Q2(cum) = 0.321.

