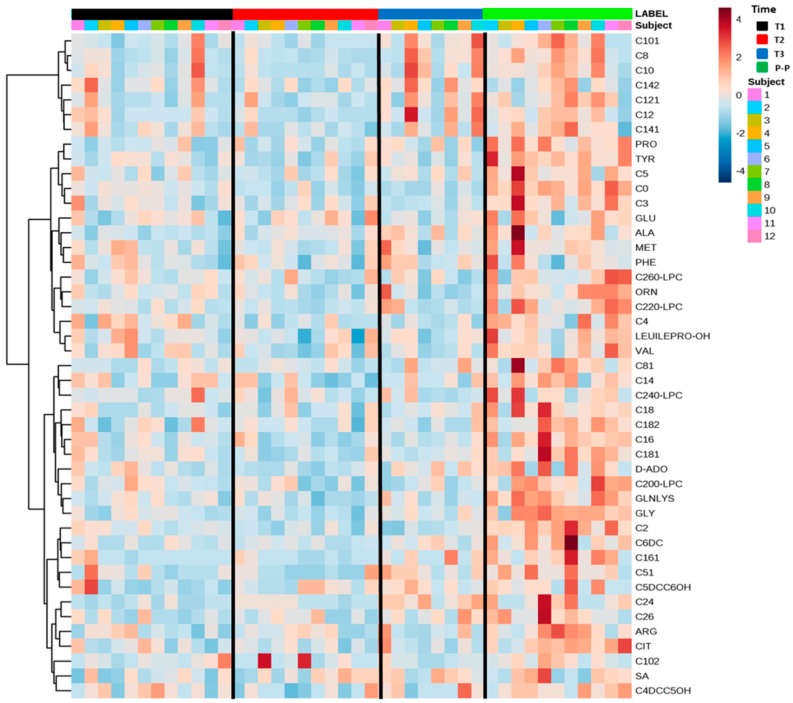
Figure 4.
The heatmap displays data related to amino acids (AAs), free carnitine (C0), acylcarnitines (ACCs), succinyl acetone (SA), nucleosides, and lysophospholipids (LPCs) in the form of colored cells. It provides direct visualization of the relative levels of individual samples and time series. At the top of the image, the black bar indicates the first trimester of pregnancy (T1), the red bar indicates the second trimester of pregnancy (T2), the blue bar indicates the third trimester of pregnancy (T3), and the green bar indicates the post-partum period. The color code describes high serum levels (red) and low serum levels (blue) of each metabolite.

